


![Apple Releases iOS 18.4 Beta 4 and iPadOS 18.4 Beta 4 [Download]](https://www.iclarified.com/images/news/96734/96734/96734-640.jpg)
![Apple Seeds watchOS 11.4 Beta 4 to Developers [Download]](https://www.iclarified.com/images/news/96737/96737/96737-640.jpg)
![Apple Seeds visionOS 2.4 Beta 4 With Apple Intelligence to Developers [Download]](https://www.iclarified.com/images/news/96740/96740/96740-640.jpg)


![What’s new in Android’s March 2025 Google System Updates [U: 3/17]](https://i0.wp.com/9to5google.com/wp-content/uploads/sites/4/2025/01/google-play-services-1.jpg?resize=1200%2C628&quality=82&strip=all&ssl=1)


![[The AI Show Episode 139]: The Government Knows AGI Is Coming, Superintelligence Strategy, OpenAI’s $20,000 Per Month Agents & Top 100 Gen AI Apps](https://www.marketingaiinstitute.com/hubfs/ep%20139%20cover-2.png)


![[The AI Show Episode 138]: Introducing GPT-4.5, Claude 3.7 Sonnet, Alexa+, Deep Research Now in ChatGPT Plus & How AI Is Disrupting Writing](https://www.marketingaiinstitute.com/hubfs/ep%20138%20cover.png)


![How to become a self-taught developer while supporting a family [Podcast #164]](https://cdn.hashnode.com/res/hashnode/image/upload/v1741989957776/7e938ad4-f691-4c9e-8c6b-dc26da7767e1.png?#)


How to Debug and Prevent Buffer Overflows in Embedded Systems
Buffer overflows are one of the most serious software bugs, especially in embedded systems, where hardware limitations and real-time execution make them hard to detect and fix. A buffer overflow happens when a program writes more data into a buffer t...
Buffer overflows are one of the most serious software bugs, especially in embedded systems, where hardware limitations and real-time execution make them hard to detect and fix.
A buffer overflow happens when a program writes more data into a buffer than it was allocated, leading to memory corruption, crashes, or even security vulnerabilities. A buffer corruption occurs when unintended modifications overwrite unread data or modify memory in unexpected ways.
In safety-critical systems like cars, medical devices, and spacecraft, buffer overflows can cause life-threatening failures. Unlike simple software bugs, buffer overflows are unpredictable and depend on the state of the system, making them difficult to diagnose and debug.
To prevent these issues, it's important to understand how buffer overflows and corruptions occur, and how to detect and fix them.
Article Scope
In this article, you will learn:
What buffers, buffer overflows, and corruptions are. I’ll give you a beginner-friendly explanation with real-world examples.
How to debug buffer overflows. You’ll learn how to use tools like GDB, LLDB, and memory maps to find memory corruption.
How to prevent buffer overflows. We’ll cover some best practices like input validation, safe memory handling, and defensive programming.
I’ll also show you some hands-on code examples – simple C programs that demonstrate buffer overflow issues and how to fix them.
What this article doesn’t cover:
Security exploits and hacking techniques. We’ll focus on preventing accidental overflows, not hacking-related buffer overflows.
Operating system-specific issues. This guide is for embedded systems, not general-purpose computers or servers.
Advanced RTOS memory management. While we discuss interrupt-driven overflows, we won’t dive deep into real-time operating system (RTOS) concepts.
Now that you know what this article covers (and what it doesn’t), let’s go over the skills that will help you get the most out of it.
Prerequisites
This article is designed for developers who have some experience with C programming and want to understand how to debug and prevent buffer overflows in embedded systems. Still, beginners can follow along, as I’ll explain key concepts in a clear and structured way.
Before reading, it helps if you know:
Basic C programming.
How memory works – the difference between stack, heap, and global variables.
Basic debugging concepts – if you’ve used a debugger like GDB or LLDB, that’s a plus, but not required.
What embedded systems are – a basic idea of how microcontrollers store and manage memory.
Even if you’re not familiar with these topics, this guide will walk you through them in an easy-to-understand way.
Before you dive into buffer overflows, debugging, and prevention, let’s take a step back and understand what a buffer is and why it’s important in embedded systems. Buffers play a crucial role in managing data flow between hardware and software but when handled incorrectly, they can lead to serious software failures.
Table of Contents
What is a Buffer, and How Does it Work?
A buffer is a contiguous block of memory used to temporarily store data before it is processed. Buffers are commonly used in two scenarios:
Data accumulation: When the system needs to collect a certain amount of data before processing.
Rate matching: When the data producer generates data faster than the data consumer can process it.
Buffers are typically implemented as arrays in C, where elements are indexed from 0 to N-1 (where N is the buffer size).
Let’s look at an example of a buffer in a sensor system.
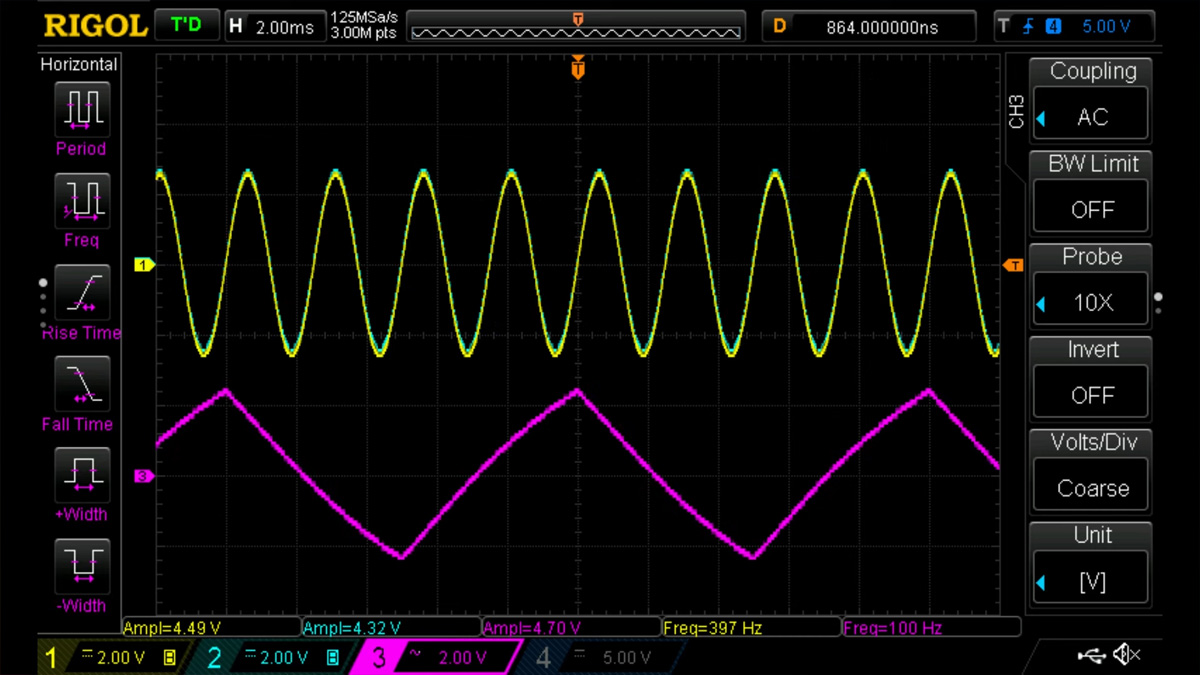
Consider a system with a sensor task that generates data at 400 Hz (400 samples per second or 1 sample every 2.5 ms). But the data processor (consumer) operates at only 100 Hz (100 samples per second or 1 sample every 10 ms). Since the consumer task is slower than the producer, we need a buffer to store incoming data until it is processed.
To determine the buffer size, we calculate:
Buffer Size = Time to consume 1 sample / Time to generate 1 sample = 10 ms/ 2.5 ms = 4
This means the buffer must hold at least 4 samples at a time to avoid data loss.
Once the buffer reaches capacity, there are several strategies to decide which data gets passed to the consumer task:
Max/min sampling: Use the maximum or minimum value in the buffer.
Averaging: Compute the average of all values in the buffer.
Random access: Pick a sample from a specific location (for example, the most recent or the first).
In real-world applications, it’s beneficial to use circular buffers or double buffering to prevent data corruption.
Circular buffer approach: A circular buffer (also called a ring buffer) continuously wraps around when it reaches the end, ensuring old data is overwritten safely without exceeding memory boundaries. The buffer size should be multiplied by 2 (4 × 2 = 8) to hold 8 samples. This allows the consumer task to process 4 samples while the next 4 samples are being filled, preventing data overwrites.
Double buffer approach: Double buffering is useful when data loss is unacceptable. It allows continuous data capture while the processor is busy handling previous data. A second buffer of the same size is added. When the first buffer is full, the write pointer switches to the second buffer, allowing the consumer task to process data from the first buffer while the second buffer is being filled. This prevents data overwrites and ensures a continuous data flow.
Buffers help manage data efficiently, but what happens when they are mismanaged? This is where buffer overflows and corruptions come into play.
What is a Buffer Overflow?
A buffer overflow occurs when a program writes more data into a buffer than it was allocated, causing unintended memory corruption. This can lead to unpredictable behavior, ranging from minor bugs to critical system failures.
To understand buffer overflow, let's use a simple analogy. Imagine a jug with a tap near the bottom. The jug represents a buffer, while the tap controls how much liquid (data) is consumed.
The jug is designed to hold a fixed amount of liquid. As long as water flows into the jug at the same rate or slower than it flows out, everything works fine. But if water flows in faster than it flows out, the jug will eventually overflow.
Similarly, in software, if data enters a buffer faster than it is processed, it exceeds the allocated memory space, causing a buffer overflow. In the case of a circular buffer, this can cause the write pointer to wrap around and overwrite unread data, leading to buffer corruption.
Buffer Overflows in Software
Unlike the jug, where water simply spills over, a buffer overflow in software overwrites adjacent memory locations. This can cause a variety of hard-to-diagnose issues, including:
Corrupting other data stored nearby.
Altering program execution, leading to crashes.
Security vulnerabilities, where attackers exploit overflows to inject malicious code.
When a buffer overflow occurs, data can overwrite variables, function pointers, or even return addresses, depending on where the buffer is allocated.
Buffer overflows can occur in different memory regions:
Buffer overflows in global/static memory (.bss / .data sections)
These occur when global or static variables exceed their allocated size.
The overflow can corrupt adjacent variables, leading to unexpected behavior in other modules.
Debugging is easier because memory addresses are fixed at compile time unless the compiler optimizes them. Map files provide a memory layout of variables during the compilation and linking.
Stack-based buffer overflow (more predictable, easier to debug):
Happens when a buffer is allocated in the stack (for example, local variables inside functions).
Overflowing the stack can affect adjacent local variables or return addresses, potentially crashing the program.
In embedded systems with small stack sizes, this often leads to a crash or execution of unintended code.
Heap-based buffer overflow (harder to debug):
Happens when a buffer is dynamically allocated in the heap (for example, using malloc() in C).
Overflowing a heap buffer can corrupt adjacent dynamically allocated objects or heap management structures.
Debugging is harder because heap memory is allocated dynamically at runtime, causing memory locations to vary.
Buffer Overflow vs Buffer Corruption
Buffer overflow and buffer corruption are of course related, but refer to different situations.
A buffer overflow happens when data is written beyond the allocated buffer size, leading to memory corruption, unpredictable behavior, or system crashes.
A buffer corruption happens when unintended data modifications result in unexpected software failures, even if the write remains within buffer boundaries.
Both issues typically result from poor write pointer management, lack of boundary checks, and unexpected system behavior.
Now that we've covered what a buffer overflow is and how it can overwrite memory, let’s take a closer look at how these issues affect embedded systems.
In the next section, we’ll explore how buffer overflows and corruption happen in real-world embedded systems and break down common causes, including pointer mismanagement and boundary violations.
Common Causes of Buffer Overflows and Corruption
Embedded systems use buffers to store data from sensors, communication interfaces (like UART (Universal Asynchronous Receiver-Transmitter), SPI (Serial Peripheral Interface), I2C (Inter-integrated Circuit), and real-time tasks. These buffers are often statically allocated to avoid memory fragmentation, and many implementations use circular (ring) buffers to efficiently handle continuous data streams.
Here are three common scenarios where buffer overflows or corruptions occur in embedded systems:
Writing Data Larger Than the Available Space
Issue: The software writes incoming data to the buffer without checking if there is enough space.
Example: Imagine a 100-byte buffer to store sensor data. The buffer receives variable-sized packets. If an incoming packet is larger than the remaining space, it will overwrite adjacent memory, leading to corruption.
So why does this happen?
Some embedded designs increment the write pointer after copying data, making it too late to prevent overflow.
Many low-level memory functions (memcpy, strcpy, etc.) do not check buffer boundaries, leading to unintended writes.
Without proper bound checking, a large write can exceed the buffer size and corrupt nearby memory.
Here’s a code sample to demonstrate buffer overflow in a .bss / .data section:
#include Interrupt-Driven Overflows (Real-time Systems)
Issue: The interrupt service routine (ISR) may write data faster than the main task can process, leading to buffer corruption or buffer overflow if the write pointer is not properly managed.
Example: Imagine a sensor ISR that writes incoming data into a buffer every time a new reading arrives. Meanwhile, a low-priority processing task reads and processes the data.
What can go wrong?
If the ISR triggers too frequently (due to a misbehaving sensor or high interrupt priority), the buffer may fill up faster than the processing task can keep up.
This can result in one of two failures:
Buffer Corruption: The ISR overwrites unread data, leading to loss of information.
Buffer Overflow: The ISR exceeds buffer boundaries, causing memory corruption or system crashes.
So why does this happen?
In real-time embedded systems, ISR execution preempts lower-priority tasks.
If the processing task doesn't not get enough CPU time, the buffer may become overwritten or overflow beyond its allocated scope.
System State Changes & Buffer Corruption
Issue: The system may unexpectedly reset, enter low-power mode, or changes operating state, leaving the buffer write pointers in an inconsistent state. This can result in buffer corruption (stale or incorrect data) or buffer overflow (writing past the buffer’s limits.
Example Scenarios:
Low-power wake-up issue (Buffer Overflow risk): Some embedded systems enter deep sleep to conserve energy. Upon waking up, if the buffer write pointer is not correctly reinitialized, it may point outside buffer boundaries, leading to buffer overflow and unintended memory corruption.
Unexpected mode transitions: If a sensor task is writing data and the system suddenly switches modes, the buffer states and pointers may not be cleaned up. The next time the sensor task runs, it may continue writing without clearing previous data. This can cause undefined behavior due to presence of stale data.
Now that you understand how buffer overflows and corruptions happen, let’s examine their consequences in embedded systems ranging from incorrect sensor readings to complete system failures, making debugging and prevention critical.
Consequences of Buffer Overflows
Buffer overflows can be catastrophic in embedded systems, leading to system crashes, data corruption, and unpredictable behavior. Unlike general-purpose computers, many embedded devices lack memory protection, making them particularly vulnerable to buffer overflows.
A buffer overflow can corrupt two critical types of memory:
1. Data Variables Corruption
A buffer overflow can overwrite data variables, corrupting the inputs for other software modules. This can cause unexpected behavior or even system crashes if critical parameters are modified.
For example, a buffer overflow could accidentally overwrite a sensor calibration value stored in memory. As a result, the system would start using incorrect sensor readings, leading to faulty operation and potentially unsafe conditions.
2. Function Pointer Corruption
In embedded systems, function pointers are often used for interrupt handlers, callback functions, and RTOS task scheduling. If a buffer overflow corrupts a function pointer, the system may execute unintended instructions, leading to a crash or unexpected behavior.
As an example, a function pointer controlling motor speed regulation could be overwritten. Instead of executing the correct function, the system would jump to a random memory address, causing a system fault or erratic motor behavior.
Buffer overflows are among the hardest bugs to identify and fix because their effects depend on which data is corrupted and the values it contains. A buffer overflow can affect memory in different ways:
If a buffer overflow corrupts unused memory, the system may seem fine during testing, making the issue harder to detect.
if a buffer overflow alters critical data variables, it can cause hidden logic errors that cause unpredictable behavior.
If a buffer overflow corrupts function pointers, it may crash immediately, making the problem easier to identify.
During development, if tests focus only on detecting crashes, they may overlook silent memory corruption caused by a buffer overflow. In real-world deployments, new use cases not covered in testing can trigger previously undetected buffer overflow issues, leading to unpredictable failures.
Buffer overflows can cause a chain reaction, where one overflow leads to another overflow or buffer corruption, resulting in widespread system failures. So how does this happen?
A buffer overflow corrupts a critical variable (for example, a timer interval).
The corrupted variable disrupts another module (for example, triggers the timer interrupt too frequently, causing it to push more data into a buffer than intended.).
This increased interrupt frequency forces a sensor task to write data faster than intended, eventually causing another buffer overflow or corruption by overwriting unread data.
This chain reaction can spread across multiple software modules, making debugging nearly impossible. In real-word applications, buffer overflows in embedded systems can be life-threatening:
In cars: A buffer overflow in an ECU (Electronic Control Unit) could cause brake failure or unintended acceleration.
In a spacecraft: A memory corruption issue could disable navigation systems, leading to mission failure.
Now that we’ve seen how buffer overflows can corrupt memory, disrupt system behavior, and even cause critical failures, the next step is understanding how to detect and fix them before they lead to serious issues.
How to Debug Buffer Overflows
Debugging buffer overflows in embedded systems can be complex, as their effects range from immediate crashes to silent data corruption, making them difficult to trace. A buffer overflow can cause either:
A system crash, which is easier to detect since it halts execution or forces a system reboot.
Unexpected behavior, which is much harder to debug as it requires tracing how corrupted data affects different modules.
This section focuses on embedded system debugging techniques using memory map files, debuggers (GDB/LLDB), and a structured debugging approach. Let’s look into the debuggers and memory map files.
Memory Map File (.map file)
A memory map file is generated during the linking process. It provides a memory layout of global/static variables, function addresses, and heap/stack locations. It provides a memory layout of Flash and RAM, including:
Text section (.text): Stores executable code.
Read-only section (.rodata): Stores constants and string literals.
BSS section (.bss): Stores uninitialized global and static variables.
Data section (.data): Stores initialized global and static variables.
Heap and stack locations, depending on the linker script.

If a buffer overflow corrupts a global variable, the .map file can identify nearby variables that may also be affected, provided the compiler has not optimized the memory allocation. Similarly, if a function pointer is corrupted, the .map file can reveal where it was stored in memory.
Debuggers (GDB & LLDB)
Debugging tools like GDB (GNU Debugger) and LLDB (LLVM Debugger) allow:
Controlling execution (breakpoints, stepping through code).
Inspecting variable values and memory addresses.
Getting backtraces (viewing function calls before a crash).
Extracting core dumps from microcontrollers for post-mortem analysis.
If the system halts on a crash, a backtrace (bt command in GDB) can reveal which function was executing before failure. If the overflow affects a heap-allocated variable, GDB can inspect heap memory usage to detect corruption.
The Debugging Process
Now, let’s go through a step-by-step debugging process to identify and fix buffer overflows. Once a crash or unexpected behavior occurs, follow these techniques to trace the root cause:
Step 1: Identify the misbehaving module
If the system crashes, use GDB or LLDB backtrace (bt command) to locate the last executed function. If the system behaves unexpectedly, determine which software module controls the affected functionality.
Step 2: Analyze inputs and outputs of the module
Every function or module has inputs and outputs. Create a truth table listing expected outputs for all possible inputs. Check if the unexpected behavior matches any undefined input combination, which may indicate corruption.
Step 3: Locate memory corruption using address analysis
If a variable shows incorrect values, determine its physical memory location. Depending on where the variable is stored:
Global/static variables (.bss / .data): Look up the memory map file for nearby buffers.
Heap variables: Snapshot heap allocations using GDB.
Here’s an example of using GDB to find corrupted variables:
 (gdb) print &my_variable  # Get memory address of the variable
 $1 = (int *) 0x20001000
 (gdb) x/10x 0x20001000   # Examine memory near this address, Display 10 memory words in hexadecimal format starting from 0x20001000
Step 4: Identify the overflowing buffer
If a buffer is located just before the corrupted variable, inspect its usage in the code. Review all possible code paths that write to the buffer. Check if any design limitations could cause an overflow under a specific use cases.
Step 5: Fix the root cause
If the buffer overflow happened due to missing bounds checks, add proper input validation to prevent it. Buffer design should enforce strict memory limits. The module should implement strict boundary checks for all inputs and maintain a consistent state.

In addition to GDB/LLDB, you can also use techniques like hardware tracing and fault injection to simulate buffer overflows and observe system behavior in real-time.
While debugging helps identify and fix buffer overflows, prevention is always the best approach. Let’s explore techniques that can help avoid buffer overflows altogether.
How to Prevent Buffer Overflows
You can often prevent buffer overflows through good software design, defensive programming, hardware protections, and rigorous testing. Embedded systems, unlike general-purpose computers, often lack memory protection mechanisms, which means that buffer overflow prevention critical for system reliability and security.
Here are some key techniques to help prevent buffer overflows:
Defensive Programming
Defensive programming helps minimize buffer overflow risks by ensuring all inputs are validated and unexpected conditions are handled safely.
First, it’s crucial to validate input size before writing to a buffer. Always check the write index by adding the size of data to be written prior to writing data to make sure more data is not written than the available buffer space.
Then you’ll want to make sure you have proper error handling and fail-safe mechanisms in place. If an input is invalid, halt execution, log the error, or switch to a safe state. Also, functions should indicate success/failure with helpful error codes to prevent misuse.
Sample Code:
#include Choosing the Right Buffer Design And Size
Some buffer designs handle overflow better than others. Choosing the correct buffer type and size for the application reduces the risk of corruption.
Circular Buffers (Ring Buffers) prevent out-of-bounds writes by wrapping around. They overwrite the oldest data instead of corrupting memory. These are useful for real-time streaming data (for example, UART, sensor readings). This approach is ideal for applications where data loss is unacceptable.
Ping-Pong Buffers (Double Buffers) use two buffers. One buffer fills up with data. Then, once it’s full, it switches to the second buffer while the first one is processed. This approach is beneficial for application that have strict requirements on no data loss. The buffer design should be based on the speed of write and read tasks.
Hardware Protection
Memory Protection Unit (MPU)
An MPU (Memory Protection Unit) helps detect unauthorized memory accesses, including buffer overflows, by restricting which regions of memory can be written to. It prevents buffer overflows from modifying critical memory regions and triggers a MemManage Fault if a process attemps to write outside an allowed region.
But keep in mind that, an MPU does not prevent buffer overflows – it only detects and stops execution when they occur. Not all microcontrollers have an MPU, and some low-end MCUs lack hardware protection, making software-based safeguards even more critical.
Modern C compilers provide several flags to identify memory errors at compile-time:
-Wall -Wextra: Enables useful warnings
-Warray-bounds: Detects out-of-bounds array access when the array size is known at compile-time
-Wstringop-overflow: Warns about possible overflows in string functions like memcpy and strcpy.
Testing and Validation
Testing helps detect buffer overflows before deployment, reducing the risk of field failures. Unit testing each function independently with valid inputs, boundary cases, and invalid inputs helps detect buffer-related issues early. Automated testing involves feeding random and invalid inputs into the system to uncover crashes and unexpected behavior. Static Analysis Tools like Coverity, Clang Static Analyzer help detect buffer overflows before runtime. Run real-world inputs on embedded hardware to detect issues.
Now that we've explored how to identify, debug, and prevent buffer overflows, it’s clear that these vulnerabilities pose a significant threat to embedded systems. From silent data corruption to catastrophic system failures, the consequences can be severe.
But with the right debugging tools, systematic analysis, and preventive techniques, you can effectively either prevent or mitigate buffer overflows in your systems.
Conclusion
Buffer overflows and corruption are major challenges in embedded systems, leading to crashes, unpredictable behavior, and security risks. Debugging these issues is difficult because their symptoms vary based on system state, requiring systematic analysis using memory map files, GDB/LLDB, and structured debugging approaches.
In this article, we explored:
The causes and consequences of buffer overflows and corruptions
How to debug buffer overflows using memory analysis and debugging tools
Best practices for prevention
Buffer overflow prevention requires a multi-layered approach:
Follow a structured software design process to identify risks early.
Apply defensive programming principles to validate inputs and handle errors gracefully.
Use hardware-based protections like MPUs where available.
Enable compiler flags that help identify memory errors.
Test extensively, unit testing, automated testing, and code reviews help catch vulnerabilities early.
By implementing these best practices, you can minimize the risk of buffer overflows in embedded systems, improving reliability and security.
In embedded systems, where reliability and safety are critical, preventing buffer overflows is not just a best practice, it is a necessity. A single buffer overflow can compromise an entire system. Defensive programming, rigorous testing, and hardware protections are essential for building secure and robust embedded applications.