


![Apple Officially Announces Return of 'Ted Lasso' for Fourth Season [Video]](https://www.iclarified.com/images/news/96710/96710/96710-640.jpg)
![Apple Plans Live Translation Feature for AirPods in iOS 19 [Report]](https://www.iclarified.com/images/news/96712/96712/96712-640.jpg)
![Apple Shares Official Trailer for 'F1' Starring Brad Pitt [Video]](https://www.iclarified.com/images/news/96714/96714/96714-640.jpg)


_Tanapong_Sungkaew_Alamy.jpg?#)

_JIRAROJ_PRADITCHAROENKUL_Alamy.jpg?#)


![[The AI Show Episode 139]: The Government Knows AGI Is Coming, Superintelligence Strategy, OpenAI’s $20,000 Per Month Agents & Top 100 Gen AI Apps](https://www.marketingaiinstitute.com/hubfs/ep%20139%20cover-2.png)


![[The AI Show Episode 138]: Introducing GPT-4.5, Claude 3.7 Sonnet, Alexa+, Deep Research Now in ChatGPT Plus & How AI Is Disrupting Writing](https://www.marketingaiinstitute.com/hubfs/ep%20138%20cover.png)


Overview of Statsmodels
Having data, no matter how quality it may be, without being able or knowing how to properly analyze and draw crucial statistical insights from it I am talking about key pointers and indicators that can help inform your next big business decision could be very frustrating, this is like having a gold mine but not having the capacity to tap into it, even though it can change your life tremendously, for the better. Statistical modeling is a crucial framework used by statisticians, researchers, and data professionals to draw valuable insights from data. It largely involves the use of mathematical and statistical techniques and methodologies to analyze, represent, predict, and interpret data. It gives sufficient information that aids proper understanding of given data, leading to informed decision-making. It is to this end that different tools were developed for conducting statistical modeling. To name only a few tools used for this purpose, we have: Python libraries (statsmodel, sci-kit-learn, pandas). R programming language (Specifically designed for scientific computing tasks). SAS/SPSS (A commercial software for advanced statistical analysis). Excel (Used for simple statistical modeling and visualization) In this article, we will be focusing on statsmodel; we will learn about its various tools and how it is used for statistical modeling with a simple code illustration. Prerequisites Prior knowledge of Python programming and statistical operations on datasets is useful, as it would ease the understanding of this article’s content. What is statsmodel ? statsmodel contains methods and classes used for statistical modeling. According to the official website of statsmodel, “statsmodel is a Python module that provides classes and functions for the estimation of many different statistical models, as well as for conducting statistical tests and statistical data exploration.” The ability of statsmodel to integrate easily with pandas and numpy libraries, which are very popular and commonly used tools for data operations, such as loading, exploring, and manipulating datasets, makes it favorable to Data Professionals. statsmodel contains various statistical tools often used by professionals to conduct statistical operations on data. Listed below are some of the predominantly used statsmodel tools for performing various tasks: Time series-analysis: When performing time series tasks (analyzing and forecasting time series data) with statsmodel, ARIMA (AutoRegressive Integrated Moving Average) and SARIMAX (Seasonal AutoRegressive Integrated Moving Average with eXogenous variables) models are commonly used. Data Visualization: statsmodel contains plotting functions that can be used to create visual representations of statistical data and also visualize model diagnostics. Linear Regression Model: Ordinary Least Squares (OLS), Generalized Least Squares (GLS), and Weighted Least Squares (WLS) are all tools available in statsmodel, they are used for analyzing Linear Regression models. They all have their various use cases. Statistical Tests: statsmodel provides numerous testing frameworks for conducting statistical tests on data, these tools can be used for both hypothesis testing and diagnosis. Here are some of the tests that statsmodel provides: t-tests (used to compare the means of two distinct groups of data), chi-squared tests (Used for testing the relationships that exist between categorical data, that is, text data), ANOVA (Analysis of Variance), unlike the t-test that compares the means of two data groups, ANOVA is used to compare the mean of multiple data groups. Datasets: In-built datasets are available in statsmodel and can be used to practice and test operations. Nonparametric methods: These are tools provided by the statsmodel module for analyzing data without assuming a specific distribution. To achieve this, the Kernel Density Estimation (KDE) approach is predominantly used. Applications of statsmodel statsmodel has numerous real-world applications, and it is used in various industries to carry out niche tasks. Here are some key areas where statsmodel is utilized: Finance: statsmodel is used in finance for forecasting and risk analysis. Time series can be used to monitor stock prices and returns. Econometrics: Economic data can be analyzed, and economic theories can be tested using the statsmodel. Marketing: E-commerce companies use statsmodel to analyze and understand customer behavior while interacting with their business to predict demand and strategize for better profitability. Energy: In the energy sector, the statsmodel is used to forecast energy consumption and pricing at a given time for electricity and gas markets. Manufacturing: In the manufacturing industry, the statsmodel is used for predictive maintenance; it predicts potential failure from analyzing previous data. How to install and use statsmodel So far in this article, we have lea
Having data, no matter how quality it may be, without being able or knowing how to properly analyze and draw crucial statistical insights from it I am talking about key pointers and indicators that can help inform your next big business decision could be very frustrating, this is like having a gold mine but not having the capacity to tap into it, even though it can change your life tremendously, for the better.
Statistical modeling is a crucial framework used by statisticians, researchers, and data professionals to draw valuable insights from data. It largely involves the use of mathematical and statistical techniques and methodologies to analyze, represent, predict, and interpret data. It gives sufficient information that aids proper understanding of given data, leading to informed decision-making. It is to this end that different tools were developed for conducting statistical modeling. To name only a few tools used for this purpose, we have:
- Python libraries (statsmodel, sci-kit-learn, pandas).
- R programming language (Specifically designed for scientific computing tasks).
- SAS/SPSS (A commercial software for advanced statistical analysis).
- Excel (Used for simple statistical modeling and visualization)
In this article, we will be focusing on statsmodel; we will learn about its various tools and how it is used for statistical modeling with a simple code illustration.
Prerequisites
Prior knowledge of Python programming and statistical operations on datasets is useful, as it would ease the understanding of this article’s content.
What is statsmodel ?
statsmodel contains methods and classes used for statistical modeling. According to the official website of statsmodel, “statsmodel is a Python module that provides classes and functions for the estimation of many different statistical models, as well as for conducting statistical tests and statistical data exploration.”
The ability of statsmodel to integrate easily with pandas and numpy libraries, which are very popular and commonly used tools for data operations, such as loading, exploring, and manipulating datasets, makes it favorable to Data Professionals.
statsmodel contains various statistical tools often used by professionals to conduct statistical operations on data. Listed below are some of the predominantly used statsmodel tools for performing various tasks:
Time series-analysis: When performing time series tasks (analyzing and forecasting time series data) with statsmodel, ARIMA (AutoRegressive Integrated Moving Average) and SARIMAX (Seasonal AutoRegressive Integrated Moving Average with eXogenous variables) models are commonly used.
Data Visualization: statsmodel contains plotting functions that can be used to create visual representations of statistical data and also visualize model diagnostics.
Linear Regression Model: Ordinary Least Squares (OLS), Generalized Least Squares (GLS), and Weighted Least Squares (WLS) are all tools available in statsmodel, they are used for analyzing Linear Regression models. They all have their various use cases.
Statistical Tests: statsmodel provides numerous testing frameworks for conducting statistical tests on data, these tools can be used for both hypothesis testing and diagnosis. Here are some of the tests that statsmodel provides: t-tests (used to compare the means of two distinct groups of data), chi-squared tests (Used for testing the relationships that exist between categorical data, that is, text data), ANOVA (Analysis of Variance), unlike the t-test that compares the means of two data groups, ANOVA is used to compare the mean of multiple data groups.
Datasets: In-built datasets are available in statsmodel and can be used to practice and test operations.
Nonparametric methods: These are tools provided by the statsmodel module for analyzing data without assuming a specific distribution. To achieve this, the Kernel Density Estimation (KDE) approach is predominantly used.
Applications of statsmodel
statsmodel has numerous real-world applications, and it is used in various industries to carry out niche tasks.
Here are some key areas where statsmodel is utilized:
Finance: statsmodel is used in finance for forecasting and risk analysis. Time series can be used to monitor stock prices and returns.
Econometrics: Economic data can be analyzed, and economic theories can be tested using the statsmodel.
Marketing: E-commerce companies use statsmodel to analyze and understand customer behavior while interacting with their business to predict demand and strategize for better profitability.
Energy: In the energy sector, the statsmodel is used to forecast energy consumption and pricing at a given time for electricity and gas markets.
Manufacturing: In the manufacturing industry, the statsmodel is used for predictive maintenance; it predicts potential failure from analyzing previous data.
How to install and use statsmodel
So far in this article, we have learned a lot of theories about statsmodel, laying a good foundation for building more advanced knowledge. Let’s take it a little bit further to the coding side.
Installing statsmodel
To install statsmodel on your machine, follow the steps below:
Step 1
Create and activate a virtual environment.
On Linux/Mac OS:
python3 -m venv venv
source venv/bin/activate
On Windows OS:
python -m venv venv
venv\scripts\activate
Step 2
Install the statsmodel module on your machine by entering this code in your terminal window:
pip install statsmodels
Step 3
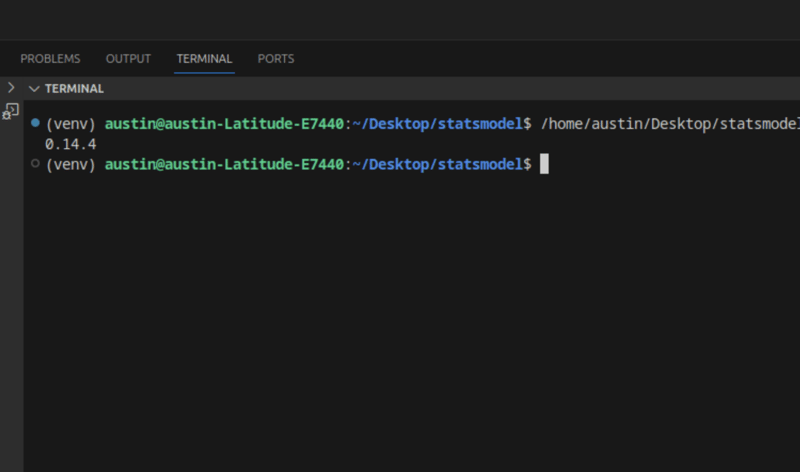
Confirm the installation was successful. Create a new Python file, and write the following code inside it:
import statsmodels.api as sm
print(sm.__version__)
After running this code, the version of statsmodel you installed should show on your terminal.
We just finished installing statsmodel; now, let us do a Linear Regression Analysis using statsmodel. Before that, let us install a dependency that we will use in our code. Run this code in your terminal window:
pip install pandas
This installs the pandas library into our created virtual environment, which is useful for loading and manipulating data.
In the Python file you created earlier, write the following code:
import statsmodels.api as sm
import pandas as pd
# Example dataset
data = sm.datasets.get_rdataset("mtcars").data
# Define variables
X = data[['hp', 'wt']] # Independent variables
X = sm.add_constant(X) # Add intercept
y = data['mpg'] # Dependent variable
# Fit the model
model = sm.OLS(y, X)
results = model.fit()
# Print the summary
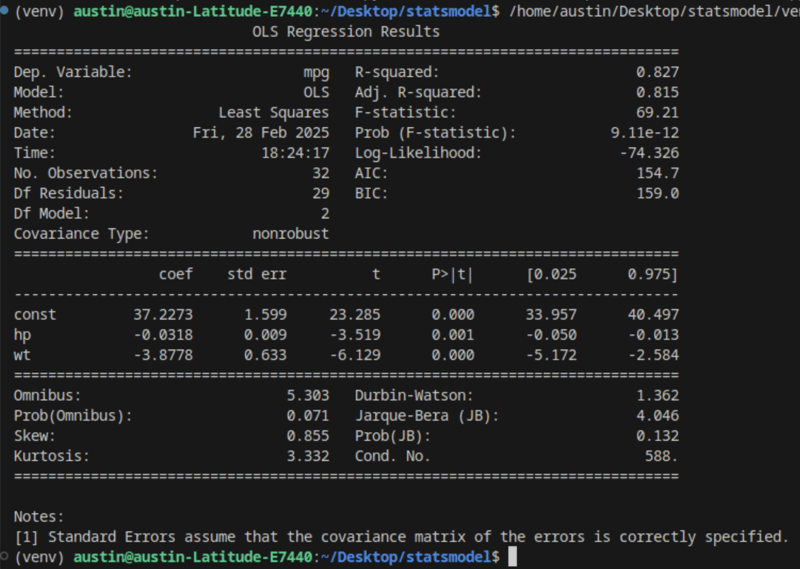
print(results.summary())
- In this code snippet, the statsmodel.api module was imported, which happens to be the main module that provides tools for statistical modeling. The pandas library was also imported to handle the data frame data type returned from the mtcars dataset.
- The dataset is stored as a pandas data frame in the data variable.
- The dependent and independent variables were extracted and stored in the y and X variables, respectively.
- The OLS (Ordinary Least Square) method was used to create an OLS regression model.
- The model was fitted to the data.
- Lastly, the summary of the model was printed, which shows a detailed overview of the regression results.
When you run this code, you should get an output similar to what is shown in the image below.
Conclusion
In this article, we’ve explored the power of statsmodel and its role in statistical modeling and conducted linear regression analysis. statsmodel provides a comprehensive collection of tools for data professionals, researchers, and analysts.
By integrating seamlessly with pandas and numpy, statsmodel makes statistical modeling in Python intuitive and accessible. Whether you’re working in finance, healthcare, manufacturing, or marketing, this library offers powerful capabilities for extracting meaningful insights from data.
As you’ve seen from our example, installing and using statsmodel is straightforward, and with a solid grasp of its tools, you can unlock new possibilities in data analysis. I recommend that you dive even deeper — experiment with other datasets and explore more advanced statistical models- to cement what you are learning and grow your expertise even more.