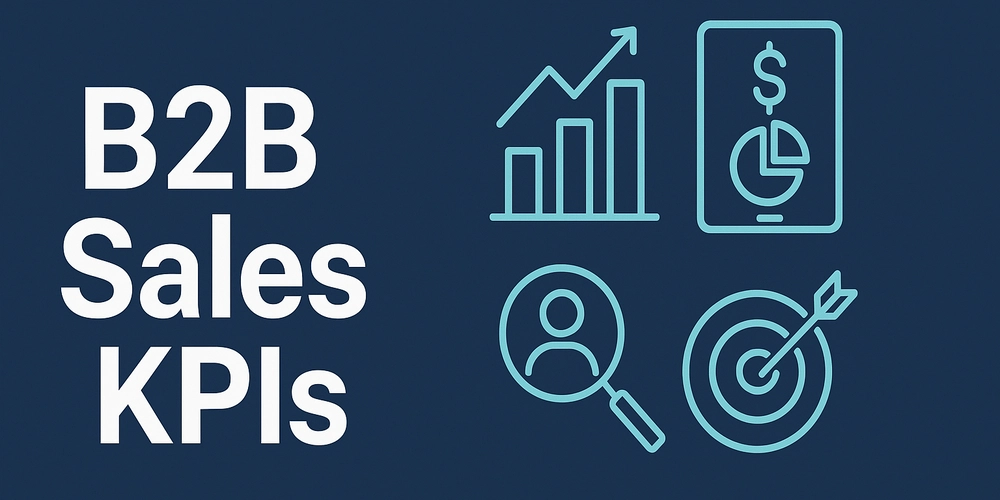
B2B Sales KPIs
1. Win Rate Win Rate = Deals Won / Total Deals × 100 Measures the efficiency of the sales team (how well the team closes deals) and the product's attractiveness to the market. 2. Sales Cycle Length Time to close the deal. Sales Cycle Length = Average time between opportunity creation and close dates. 3. Average Deal Value Super important to forecast revenue. Can be use as a metric to measure upsale and cross sale Total Revenue / Won Deals. 4. Total Sales (Value and Volume) Value: Sum of all sales revenue in a specific period. Volume: Count of Deals. 5. Sales Growth Rate How your business is growing over time. Rate of change in company sales revenue over time. Growth Rate = (Current Sales Revenue / Previous Sales Revenue) - 1 May be By Month or Qurter or Year 6. Pipeline Hygiene The practice of keeping a sales pipeline clean, organized, and up to date. Involves regularly reviewing, updating, and maintaining pipeline data to ensure it accurately reflects the status of each opportunity. The percentage of clean opportunities / total opportunities. 7. Deals Slippage Deals postponed or moved out of the expected close date. Minimizing deal slippage is crucial for maintaining high sales productivity and accurate forecasting. Slippage Rate = (Number of slipped deals / Total deals planned to close) × 100% 8. Conversion at Pipeline Sales Stages Conversion rate of opportunities from each sales stage to the next. Super important to identify gaps and areas of improvement in the sales process. Helps determine which part of the pipeline has problems. Conversion rates for each stage transition in the pipeline. 9. Average Time by Pipeline Sales Stage Average time spent by opportunities in each sales stage. 10. Pipeline Coverage Pipeline Value vs. Pipeline Target. Ensure your pipeline is strong enough to hit your targets. 11. Average Sales Per Rep Total Revenue / Number of Sales Reps. 12. Sales Velocity How fast the business generates revenue from the pipeline. Based on multiple KPIs: Sales Cycle Length, Average Deal Value, Win Rate, Pipeline Volume. Sales Velocity = (Number of Opportunities × Win Rate × Average Deal Size) / Sales Cycle Length. Discover how quickly your team converts opportunities into revenue. 14. Forecast Accuracy The percentage of how close forecasted sales are to actual sales. Forecast Accuracy (%) = (Forecasted Value / Actual Value) - 1 15. Calls Frequency Total number of inbound and outbound calls. Calls measured per agent as well.
1. Win Rate
- Win Rate = Deals Won / Total Deals × 100
- Measures the efficiency of the sales team (how well the team closes deals) and the product's attractiveness to the market.
2. Sales Cycle Length
- Time to close the deal.
- Sales Cycle Length = Average time between opportunity creation and close dates.
3. Average Deal Value
- Super important to forecast revenue.
- Can be use as a metric to measure upsale and cross sale
- Total Revenue / Won Deals.
4. Total Sales (Value and Volume)
- Value: Sum of all sales revenue in a specific period.
- Volume: Count of Deals.
5. Sales Growth Rate
- How your business is growing over time.
- Rate of change in company sales revenue over time.
- Growth Rate = (Current Sales Revenue / Previous Sales Revenue) - 1
- May be By Month or Qurter or Year
6. Pipeline Hygiene
- The practice of keeping a sales pipeline clean, organized, and up to date.
- Involves regularly reviewing, updating, and maintaining pipeline data to ensure it accurately reflects the status of each opportunity.
- The percentage of clean opportunities / total opportunities.
7. Deals Slippage
- Deals postponed or moved out of the expected close date.
- Minimizing deal slippage is crucial for maintaining high sales productivity and accurate forecasting.
- Slippage Rate = (Number of slipped deals / Total deals planned to close) × 100%
8. Conversion at Pipeline Sales Stages
- Conversion rate of opportunities from each sales stage to the next.
- Super important to identify gaps and areas of improvement in the sales process.
- Helps determine which part of the pipeline has problems.
- Conversion rates for each stage transition in the pipeline.
9. Average Time by Pipeline Sales Stage
- Average time spent by opportunities in each sales stage.
10. Pipeline Coverage
- Pipeline Value vs. Pipeline Target.
- Ensure your pipeline is strong enough to hit your targets.
11. Average Sales Per Rep
- Total Revenue / Number of Sales Reps.
12. Sales Velocity
- How fast the business generates revenue from the pipeline.
- Based on multiple KPIs: Sales Cycle Length, Average Deal Value, Win Rate, Pipeline Volume.
- Sales Velocity = (Number of Opportunities × Win Rate × Average Deal Size) / Sales Cycle Length.
- Discover how quickly your team converts opportunities into revenue.
14. Forecast Accuracy
- The percentage of how close forecasted sales are to actual sales.
- Forecast Accuracy (%) = (Forecasted Value / Actual Value) - 1
15. Calls Frequency
- Total number of inbound and outbound calls.
- Calls measured per agent as well.





















![Apple to Split Enterprise and Western Europe Roles as VP Exits [Report]](https://www.iclarified.com/images/news/97032/97032/97032-640.jpg)
![Nanoleaf Announces New Pegboard Desk Dock With Dual-Sided Lighting [Video]](https://www.iclarified.com/images/news/97030/97030/97030-640.jpg)
![Apple's Foldable iPhone May Cost Between $2100 and $2300 [Rumor]](https://www.iclarified.com/images/news/97028/97028/97028-640.jpg)































![[The AI Show Episode 144]: ChatGPT’s New Memory, Shopify CEO’s Leaked “AI First” Memo, Google Cloud Next Releases, o3 and o4-mini Coming Soon & Llama 4’s Rocky Launch](https://www.marketingaiinstitute.com/hubfs/ep%20144%20cover.png)

