


![M4 MacBook Air Drops to New All-Time Low of $912 [Deal]](https://www.iclarified.com/images/news/97108/97108/97108-640.jpg)
![New iPhone 17 Dummy Models Surface in Black and White [Images]](https://www.iclarified.com/images/news/97106/97106/97106-640.jpg)


_Olekcii_Mach_Alamy.jpg?width=1280&auto=webp&quality=80&disable=upscale#)


![[The AI Show Episode 144]: ChatGPT’s New Memory, Shopify CEO’s Leaked “AI First” Memo, Google Cloud Next Releases, o3 and o4-mini Coming Soon & Llama 4’s Rocky Launch](https://www.marketingaiinstitute.com/hubfs/ep%20144%20cover.png)


Debugging Java Code in IntelliJ IDEA
In this blog post, we will look at how to debug Java code using the IntelliJ IDEA debugger. We will look at how to fix a failing test, how to find out where an `Exception` is thrown, and how to find problems with our data. And we will learn some neat tricks about the debugger […]

In this blog post, we will look at how to debug Java code using the IntelliJ IDEA debugger. We will look at how to fix a failing test, how to find out where an `Exception` is thrown, and how to find problems with our data. And we will learn some neat tricks about the debugger in the process!
To illustrate using the debugger, we will use a small example application that reads test scores from a CSV file, calculates the average score per student, and prints the results to the console. If you’d like to follow along, you can find the code here.
Debug a failing test
One reason you might need the debugger is when one of your tests fails. In our example application, when we run the tests in `StudentTest`, we see that there is a failing test.
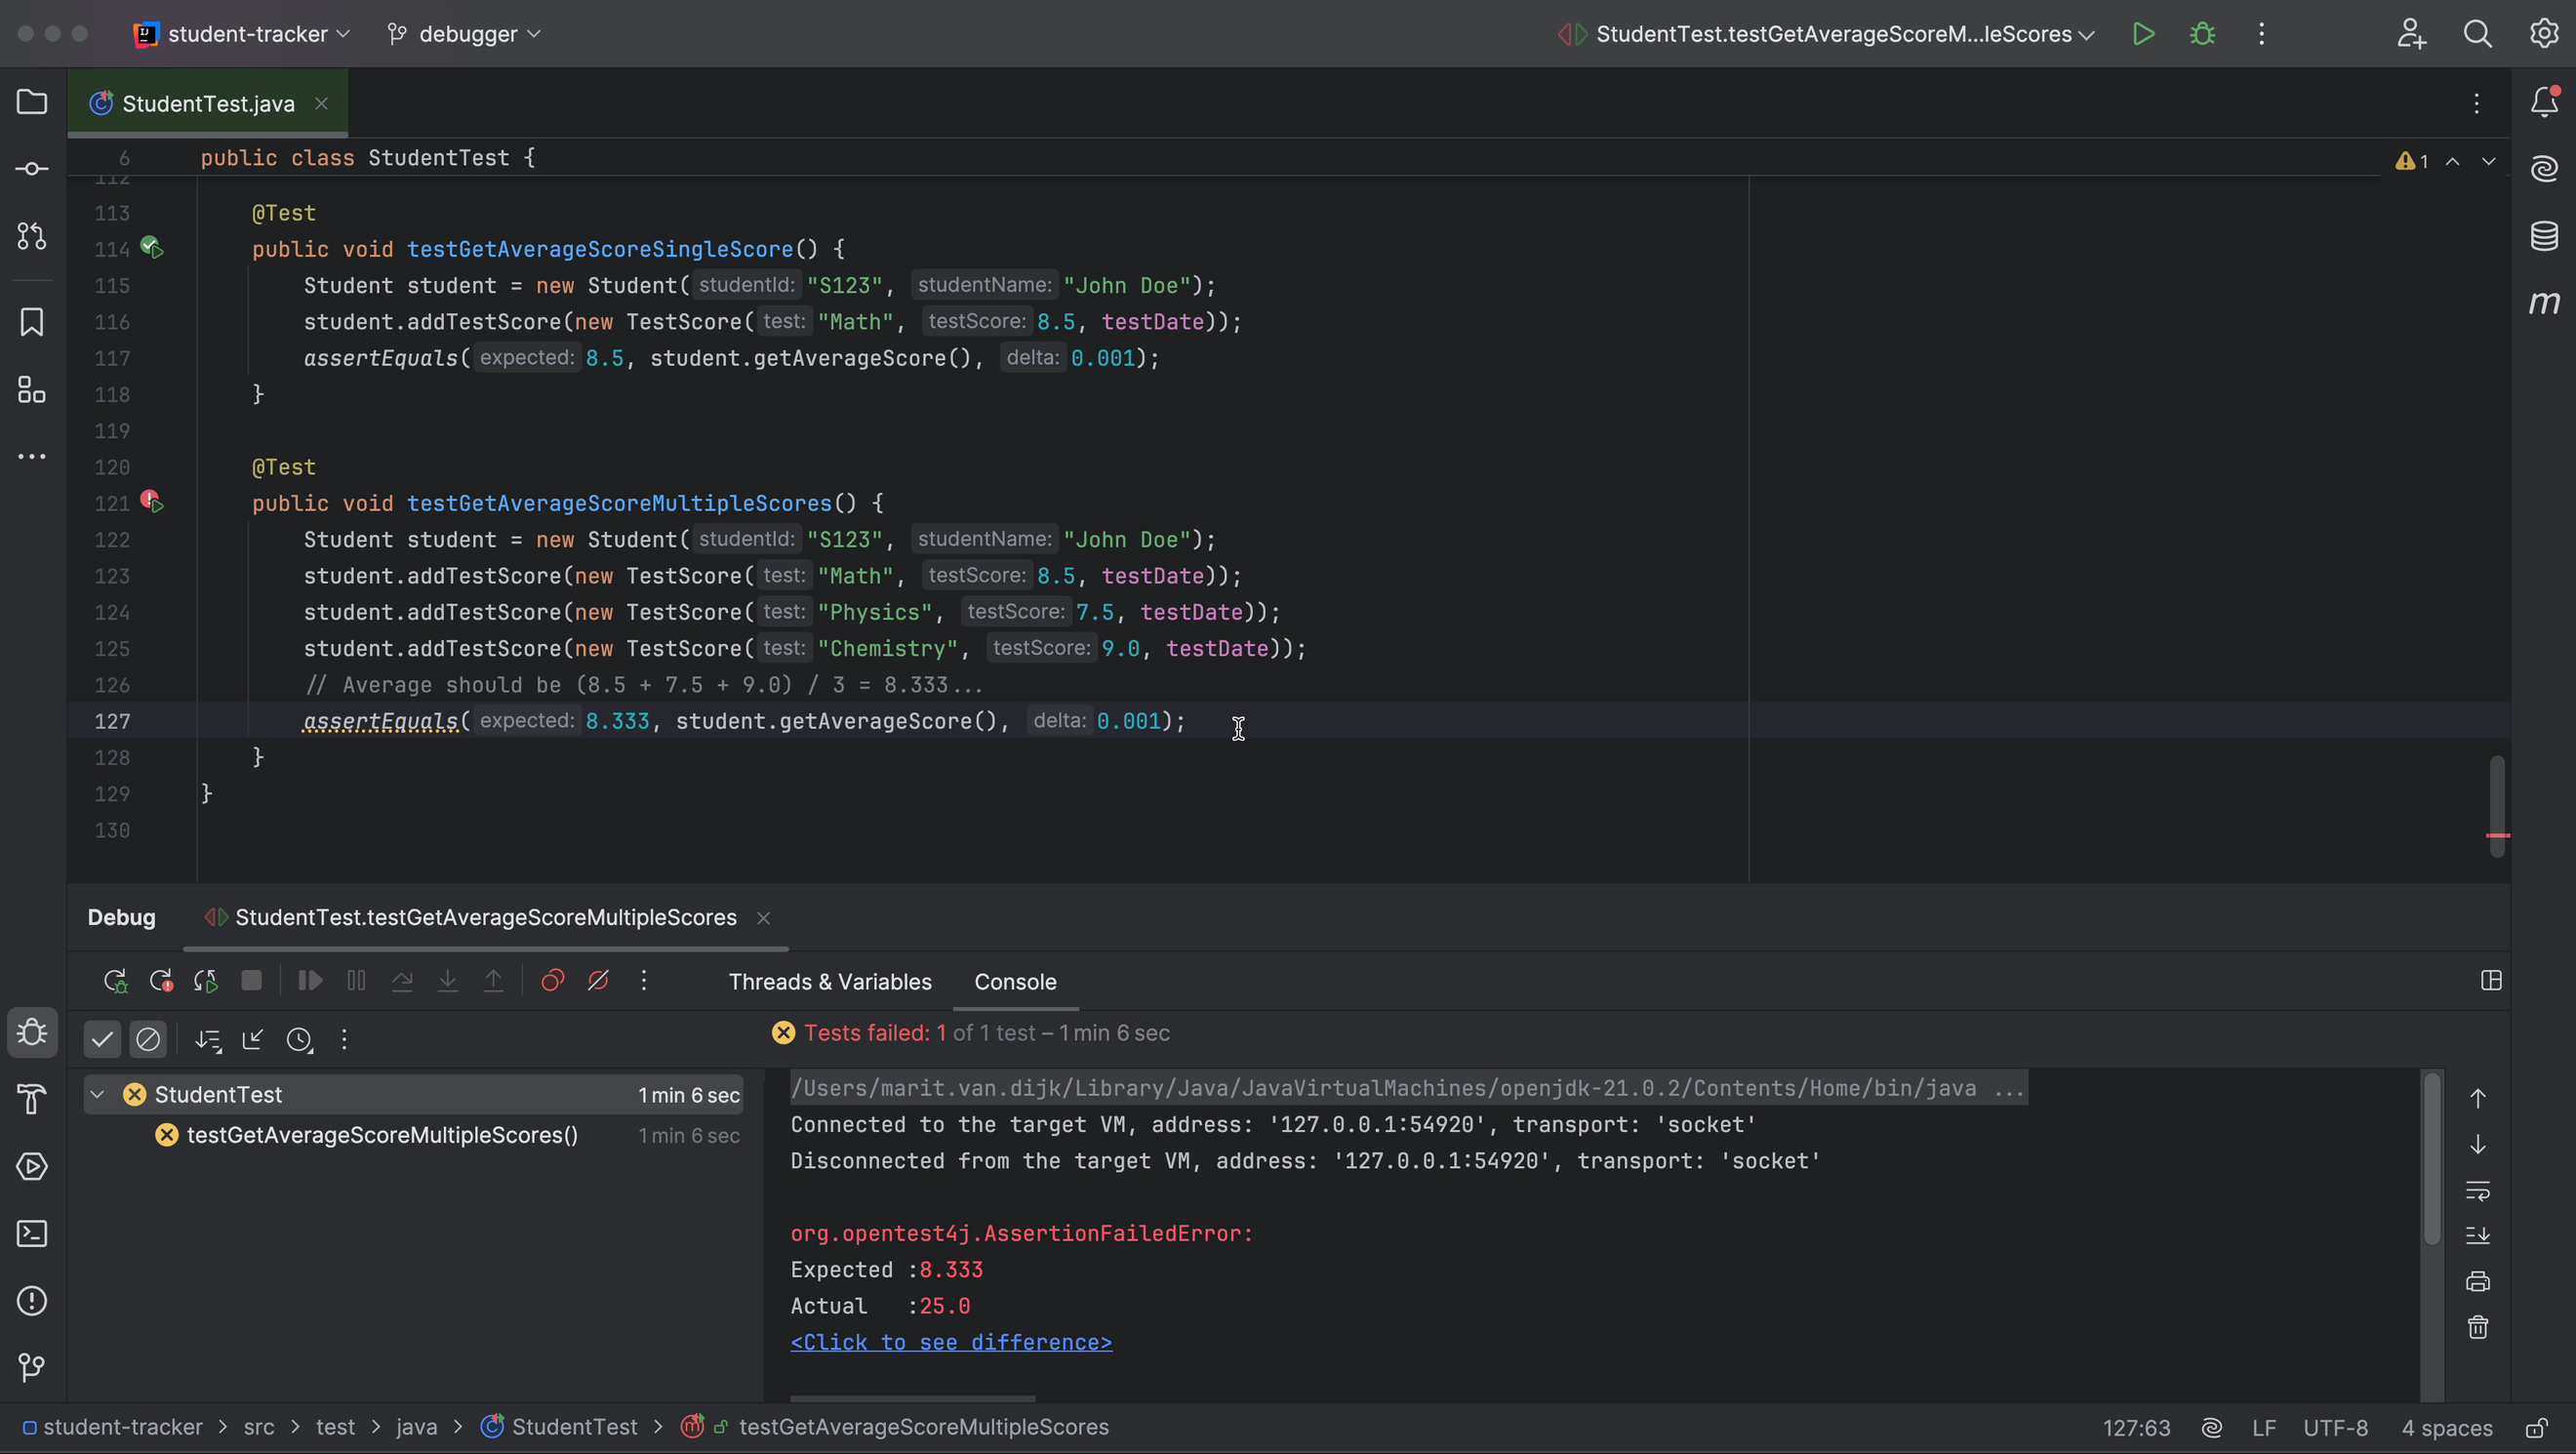
Currently, this test fails because the expected average does not match the result of the method `getAverageScore()`, as we can see on line 127. We can use the debugger to find out what the problem is and how to fix it. Let’s navigate to this method so we can set a breakpoint there to see what happens.
Set a breakpoint
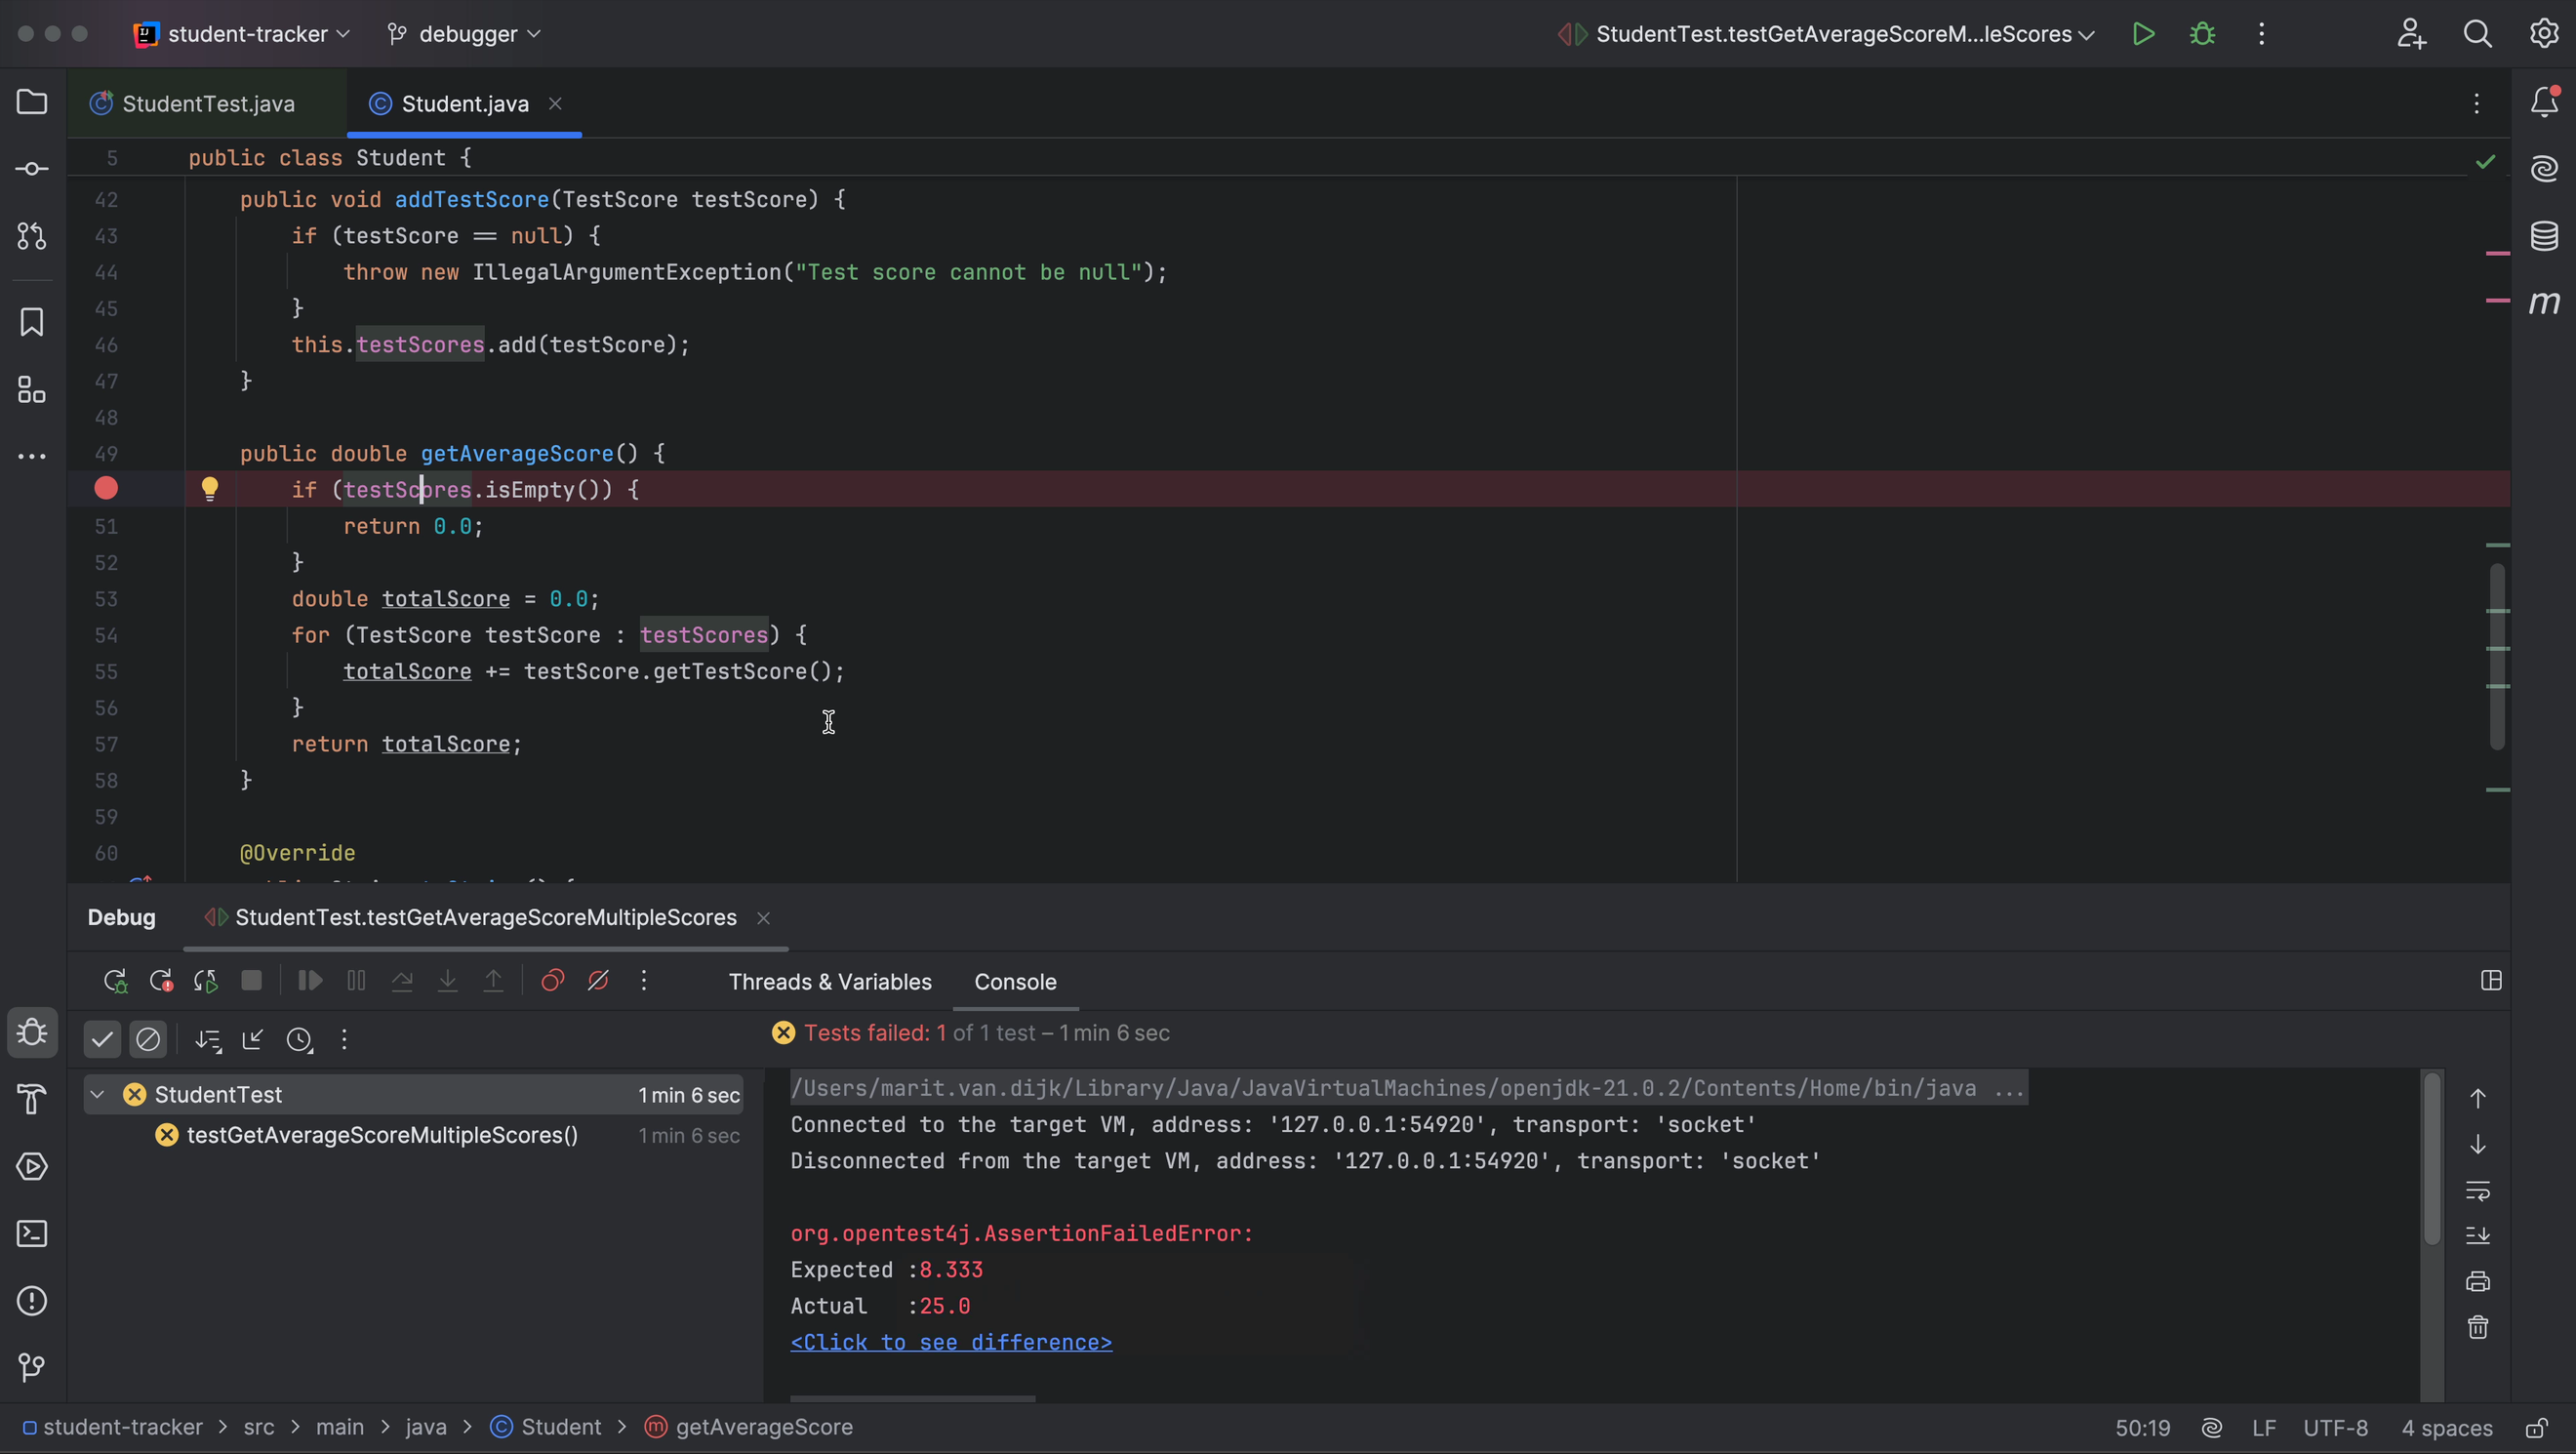
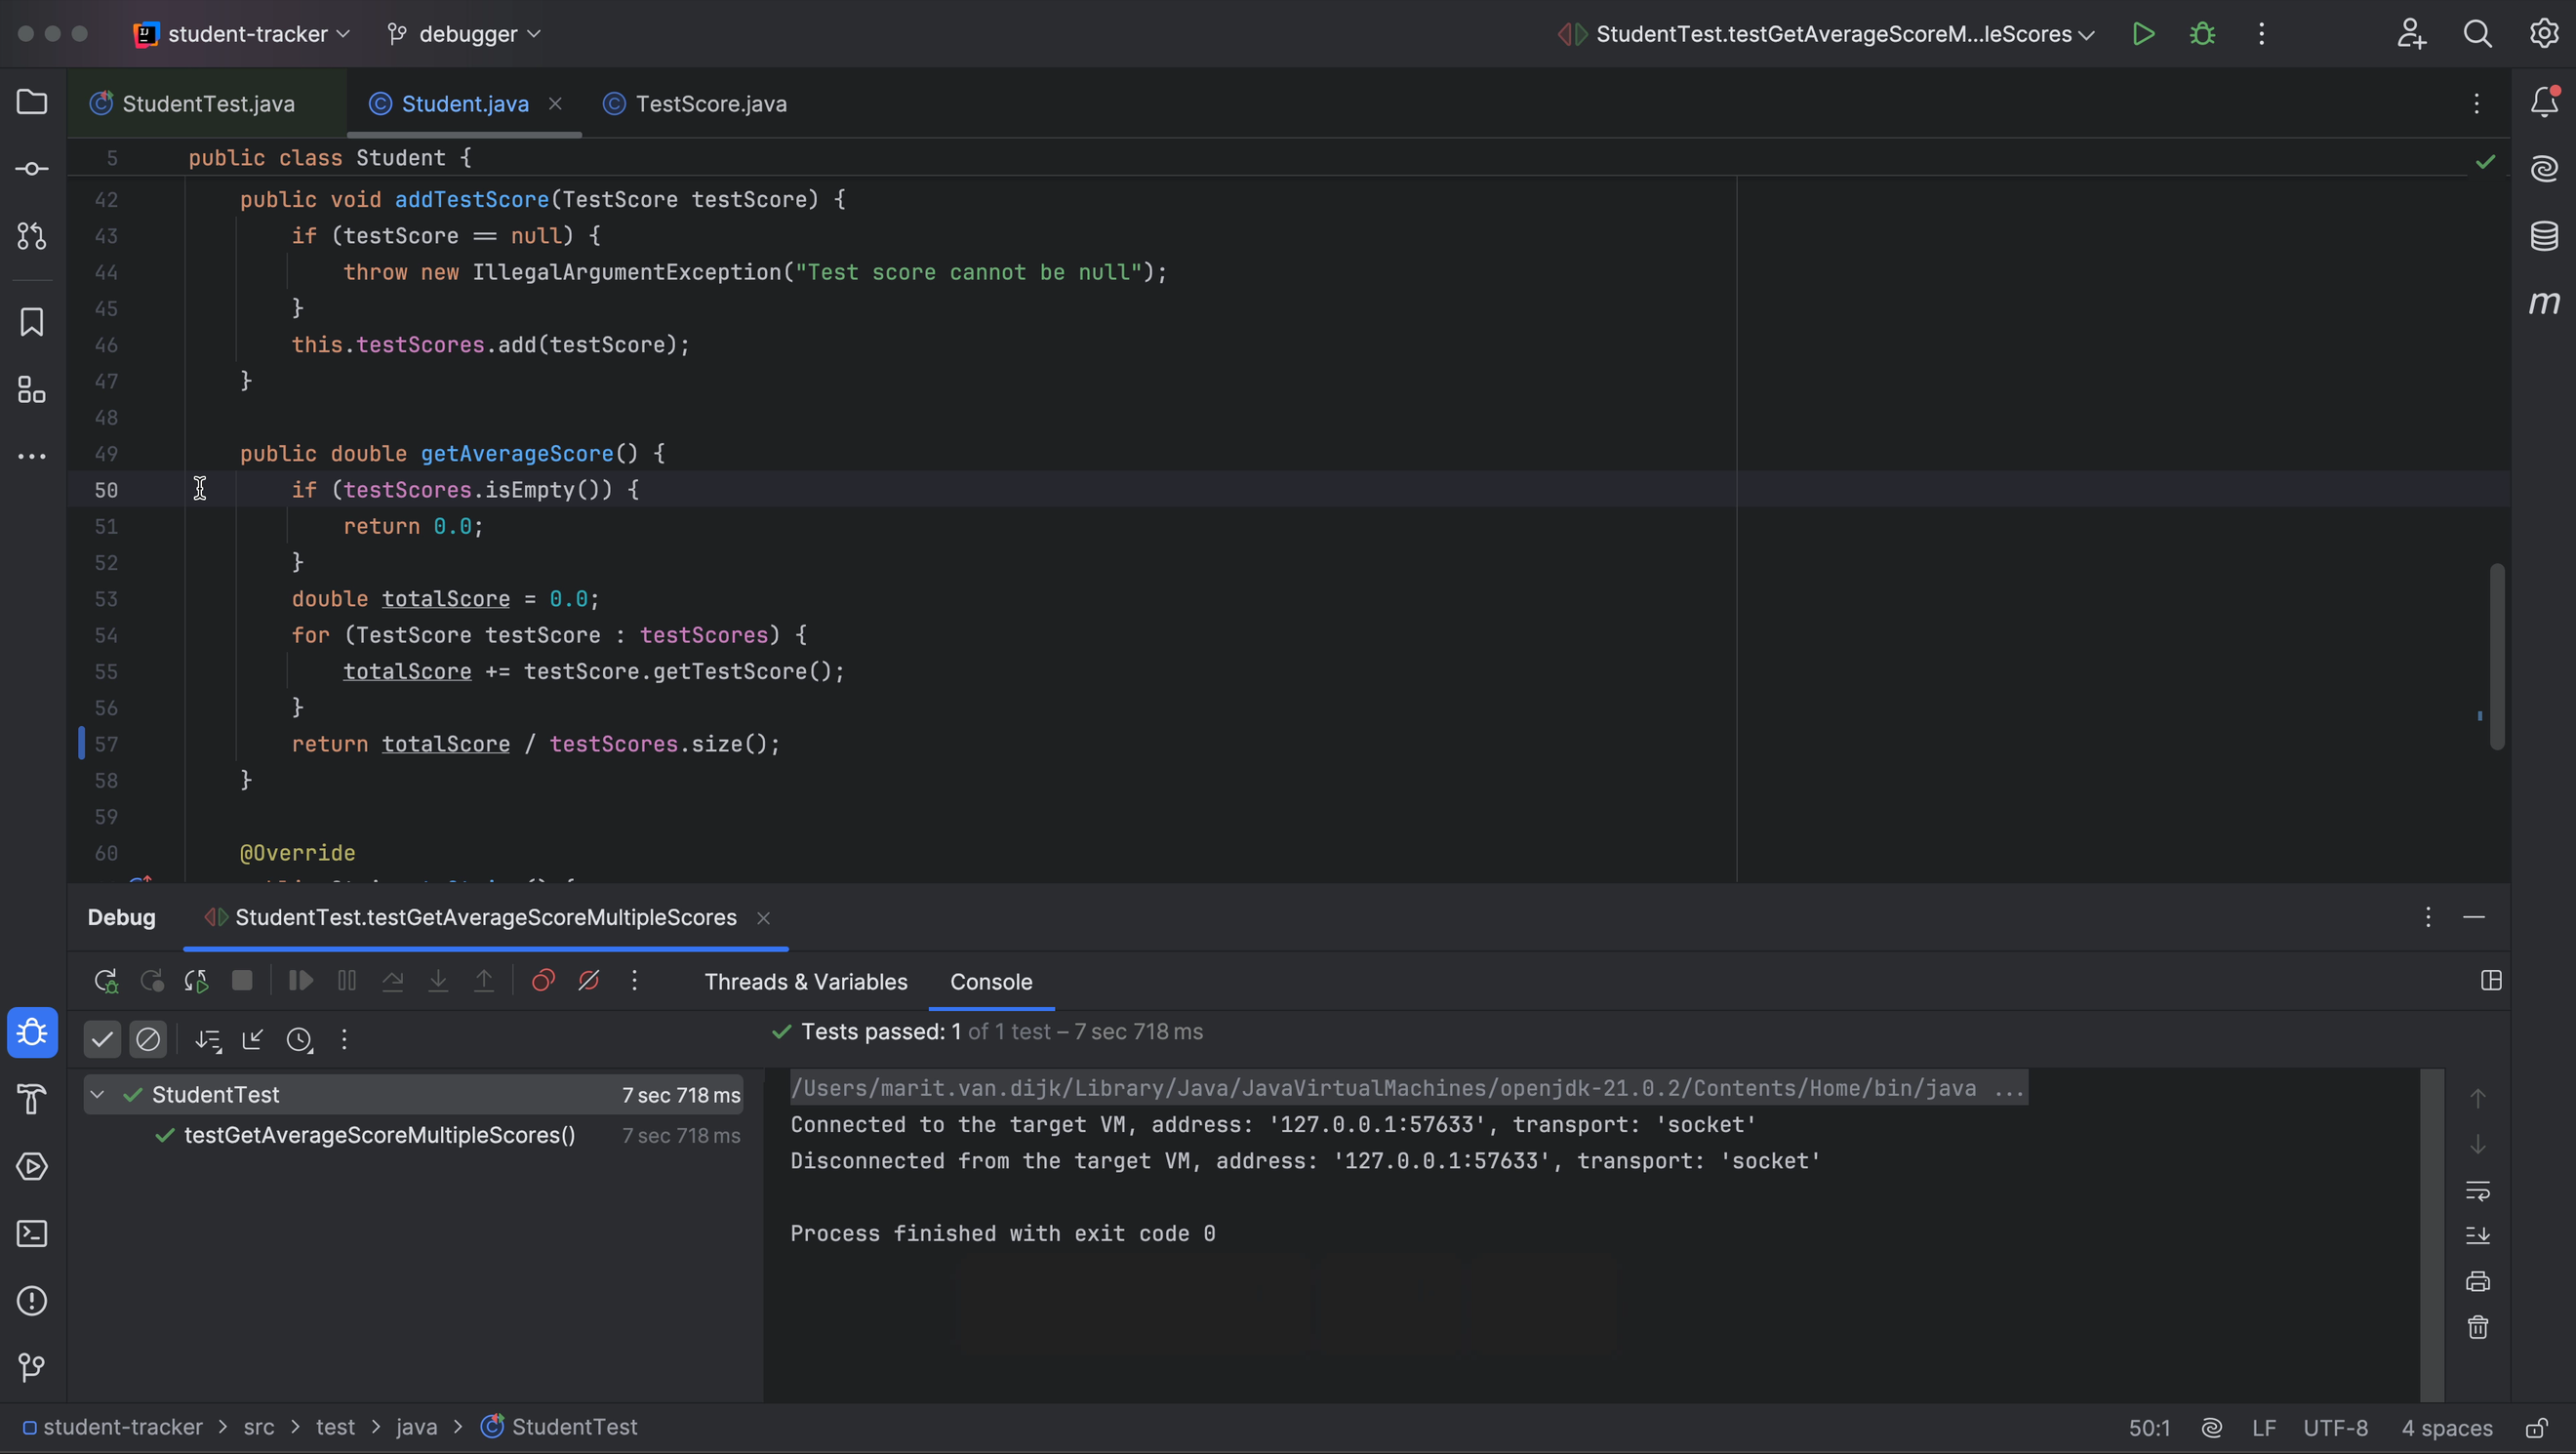
We can navigate to the method `getAverageScore()` using Jump to Source (⌘↓ on macOS / F4 on Windows/Linux) when our cursor is on the method. We can place a breakpoint, either by clicking in the gutter or using the shortcut (⌘F8 on macOS / Ctrl+F8 on Windows/Linux). Place the breakpoint on the first line of the method (line 50).
Run in Debug mode
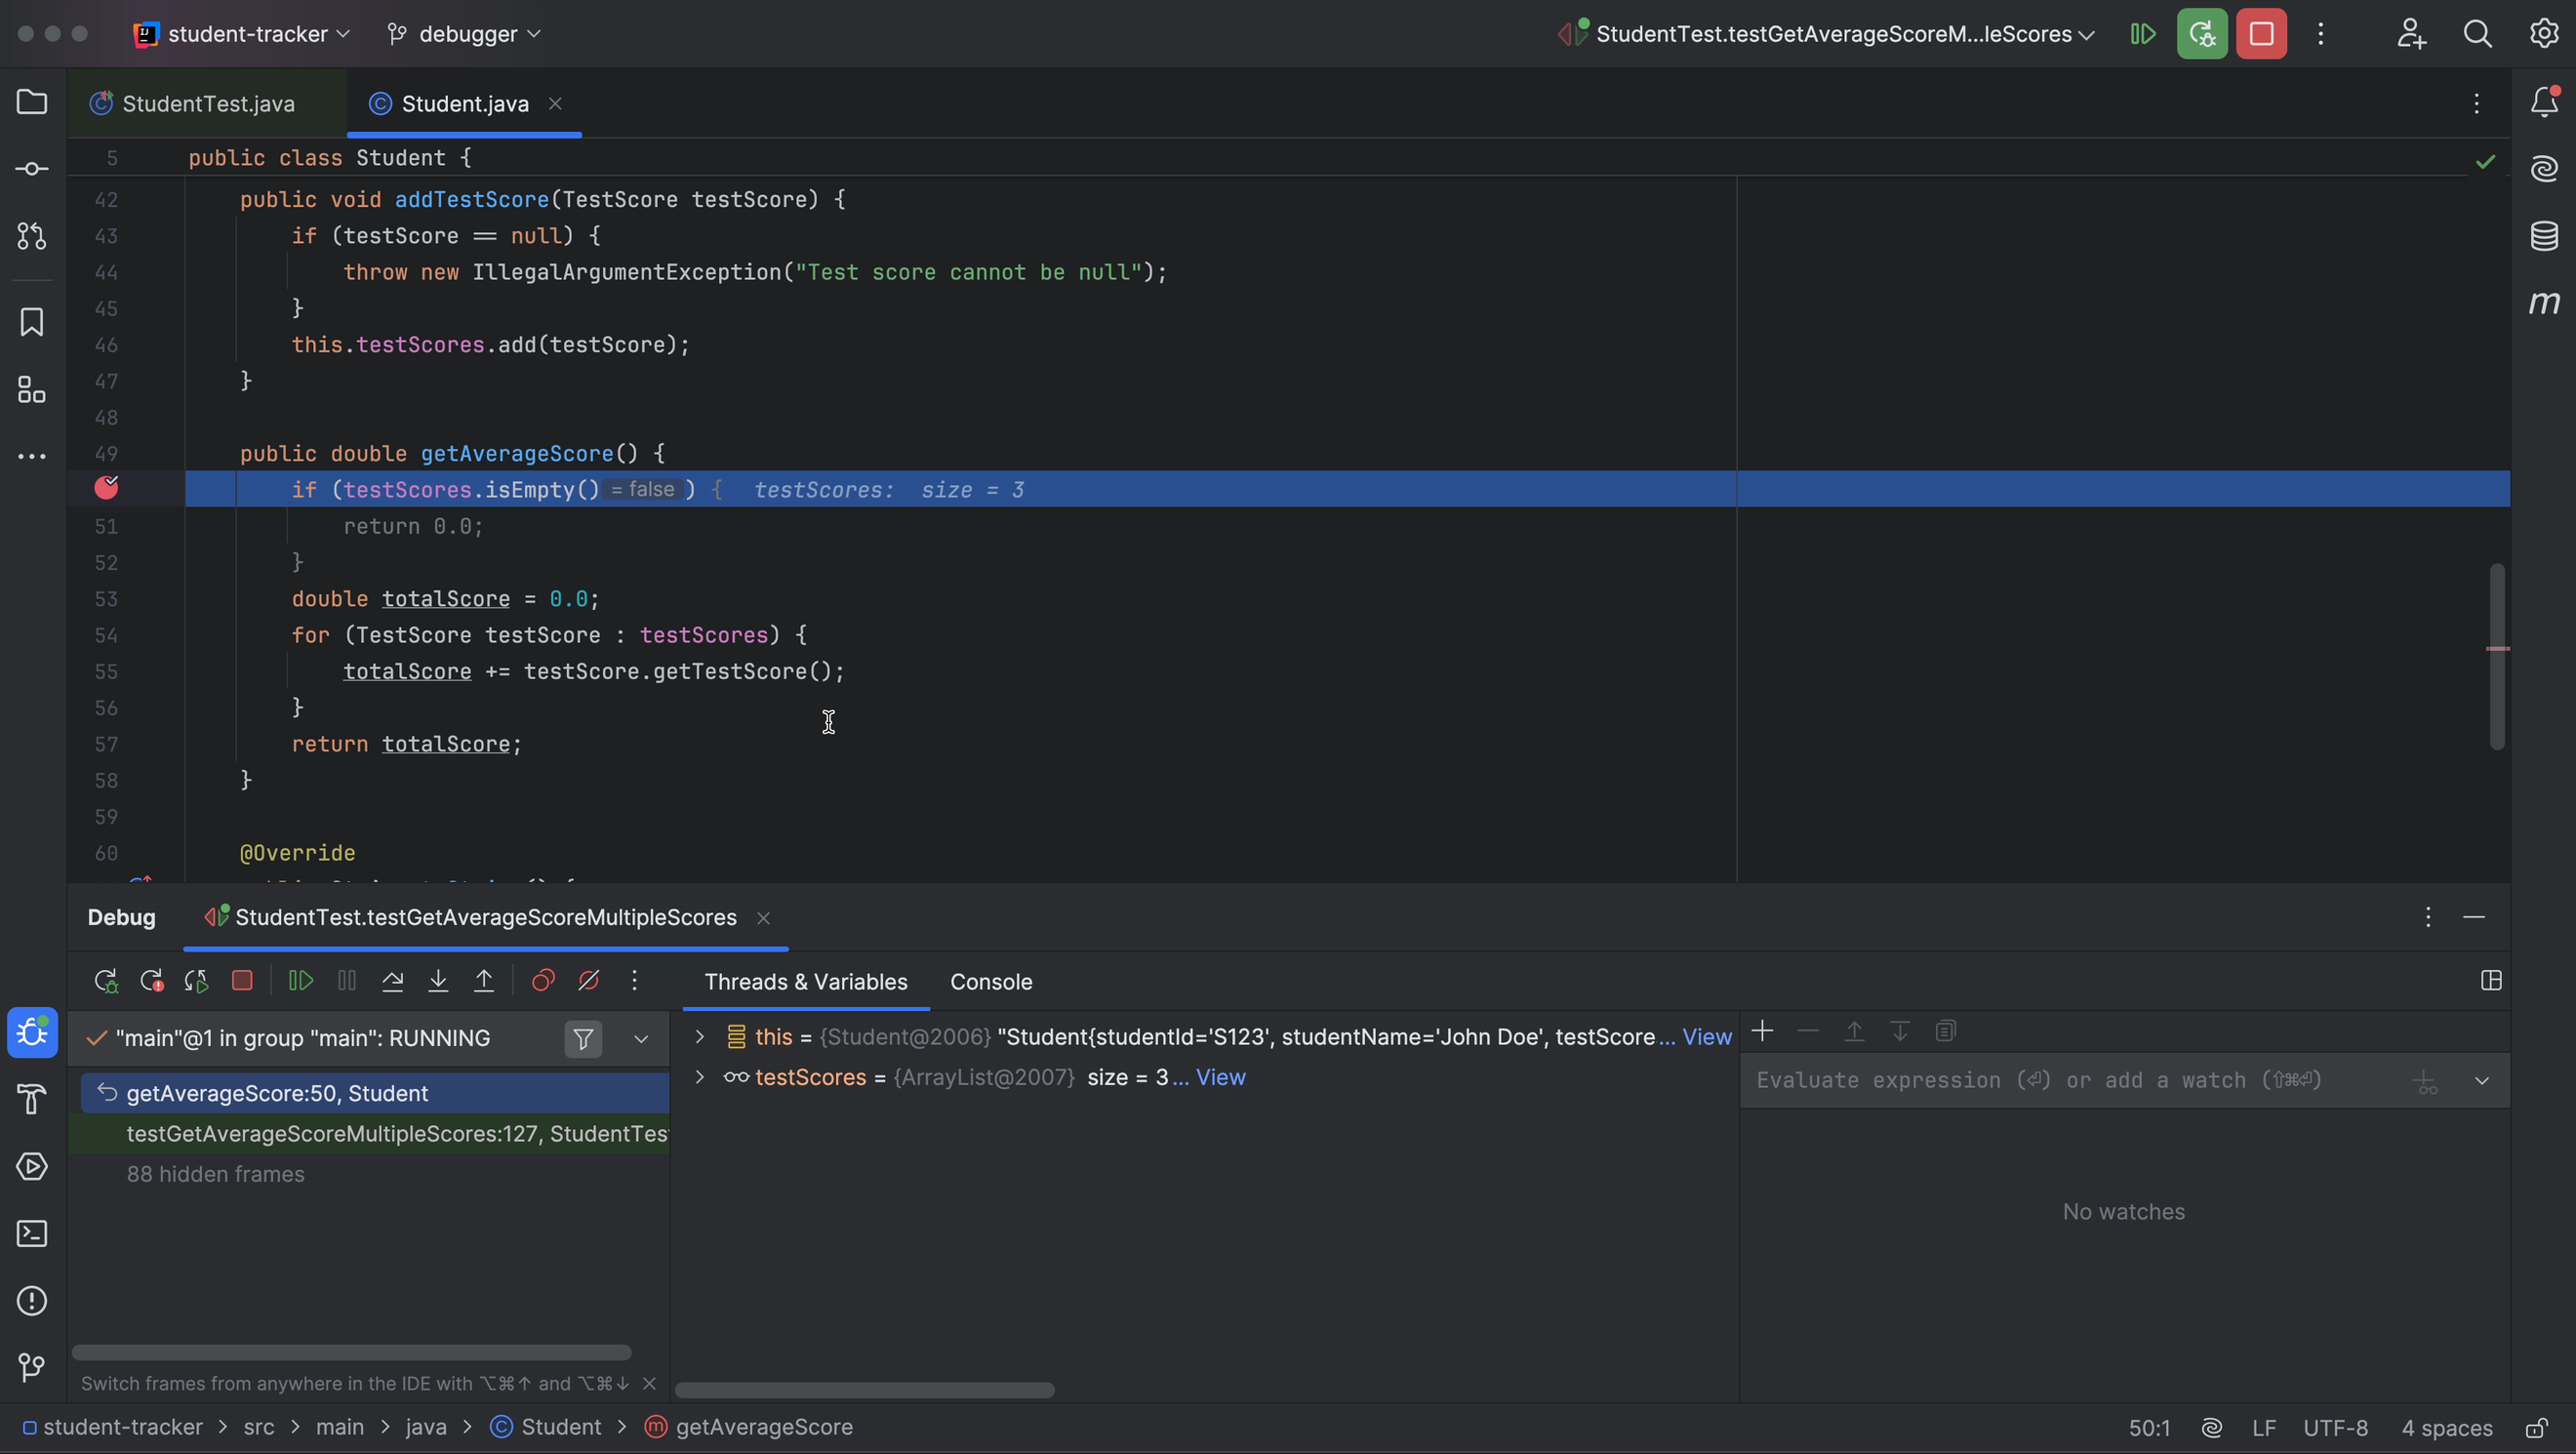
When we run the test in Debug mode (⌃D on macOS / Shift+F9 on Windows/Linux), execution will stop when it hits the breakpoint, so that we can look at the state of our application. We see inline debugging information in the editor.
Here we see that the list of `testScores` has `size = 3`. We can even click in the editor to expand this list to see details of the values in the list. We also see that `testScores.isEmpty()` evaluates to `false`, and therefore the `return` statement inside that `if` statement is unreachable and greyed out.
In the Debug tool window (⌘5 on macOS / Alt+5 on Windows/Linux), we see the call stack (the methods that were called) on the left. We can also see information about objects and variables, like the student and their test scores, in this example.
Stepping through the application
Now, we can step through the code to see what happens, using different step actions.
Use Step Over (F8) to step over a line and go to the next line, or use Step Into (F7) to step into a method that is called on a line. In this example, we can step into `getTestScore()` – which isn’t very interesting. When we step into a method, we can continue stepping to return to the call site once we exit the method, or use Step Out (Shift F8) to return right away. Notice that the variables and values that are shown inline and in the Debug tool window are updated as we step through the program.
Once all the scores have been added, we see that the` totalScore` is 25. And here, we see the problem with our logic: we forgot to divide by the number of test scores!
Evaluate expression
To fix our problem, we need to divide the total score by the number of test scores. To make sure our intended fix is correct, we can use Evaluate Expression. Right-click on `totalScore` in the editor to open the context menu and select Evaluate Expression. Alternatively, use the shortcut ⌥F8 on macOS / Alt+F8 on Windows/Linux.
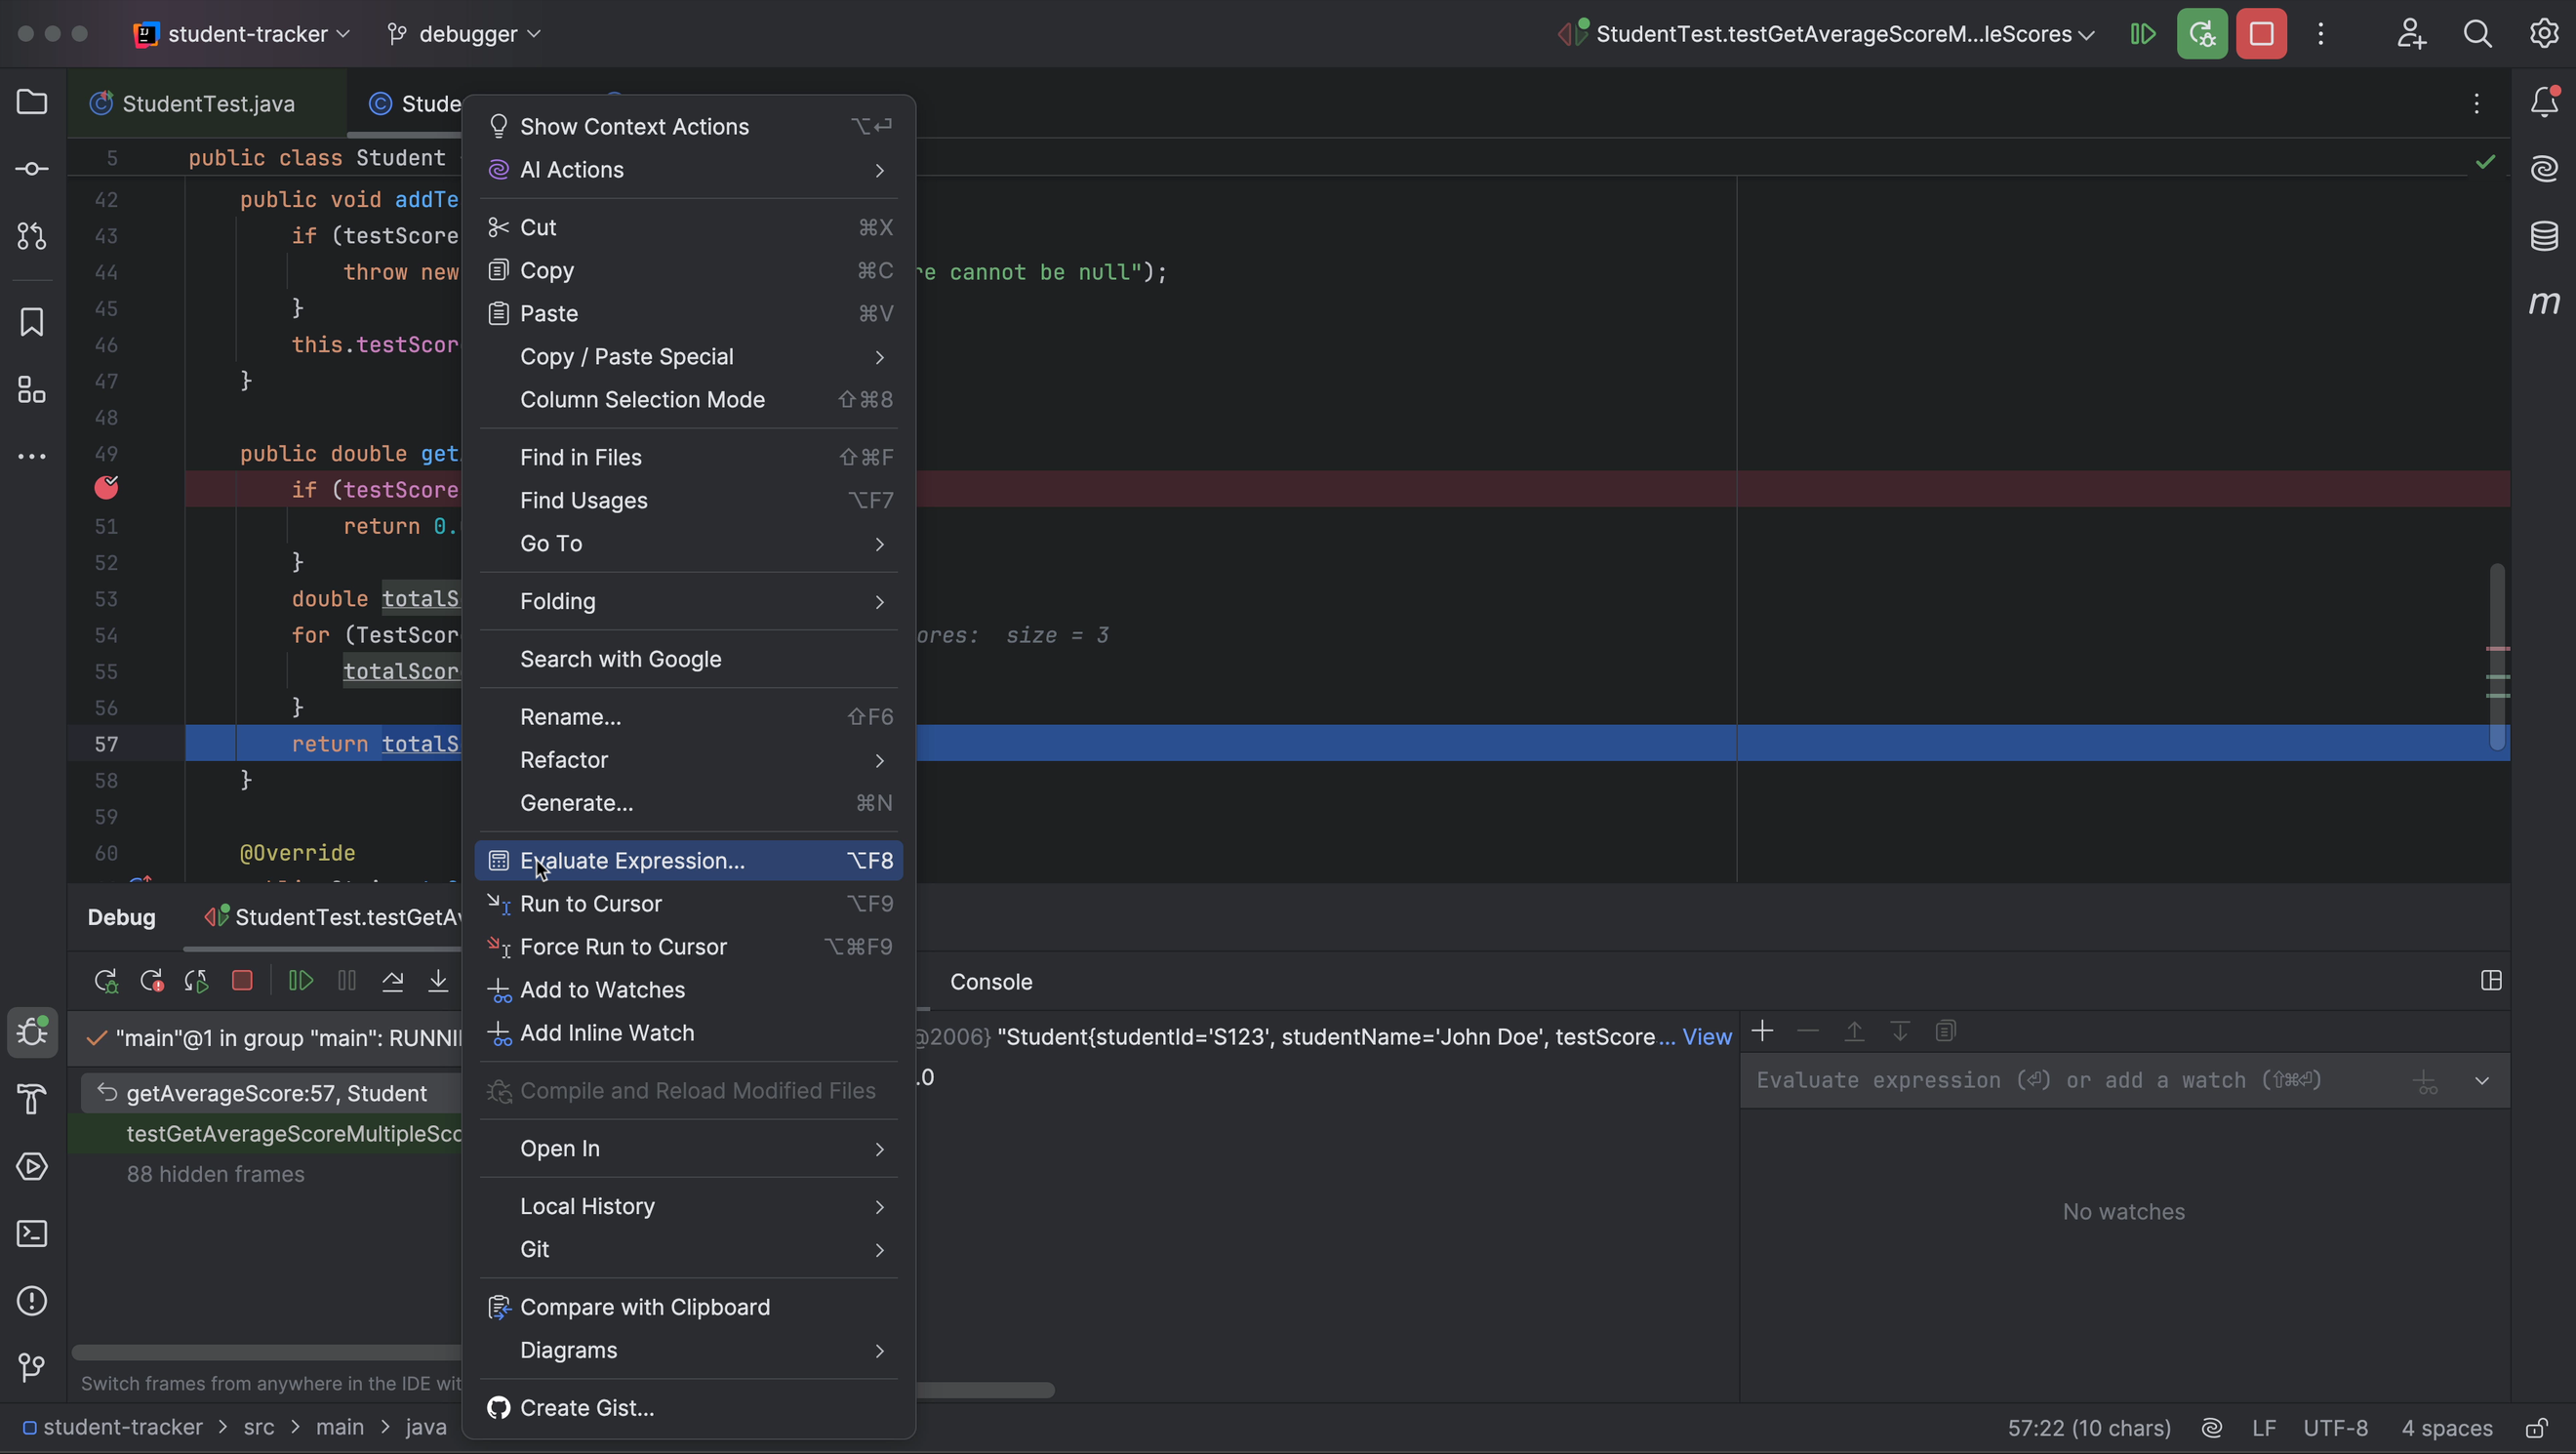
If we evaluate `totalScore`, we get 25.0, as we can already see in the debugger. However, we can use Evaluate Expression to evaluate other expressions, even ones not currently part of our code. Here we can try out potential solutions. For example, if we evaluate `totalScore / testScores.size()`, we get “8.333333333333334”, which is the expected average.
Apply fix and rerun tests
Let’s apply our fix to the code to return `totalScore / testScores.size()` instead of `totalScore` from the method `getAverageScore()`. When we rerun the test, we see that it now passes. Note that you might want to run all tests to make sure that your fix has not had any unintended side effects.
Since we no longer need the breakpoint, we can remove it, either by clicking the breakpoint in the gutter or by using the shortcut ⌘F8 on macOS / Ctrl+F8 on Windows/Linux.
Run the application
Now that we’ve fixed our failing test and all the tests pass, let’s see if our application works correctly. Go to the `Main` class and run it, for example, by clicking the Run button in the gutter.
Debug an Exception
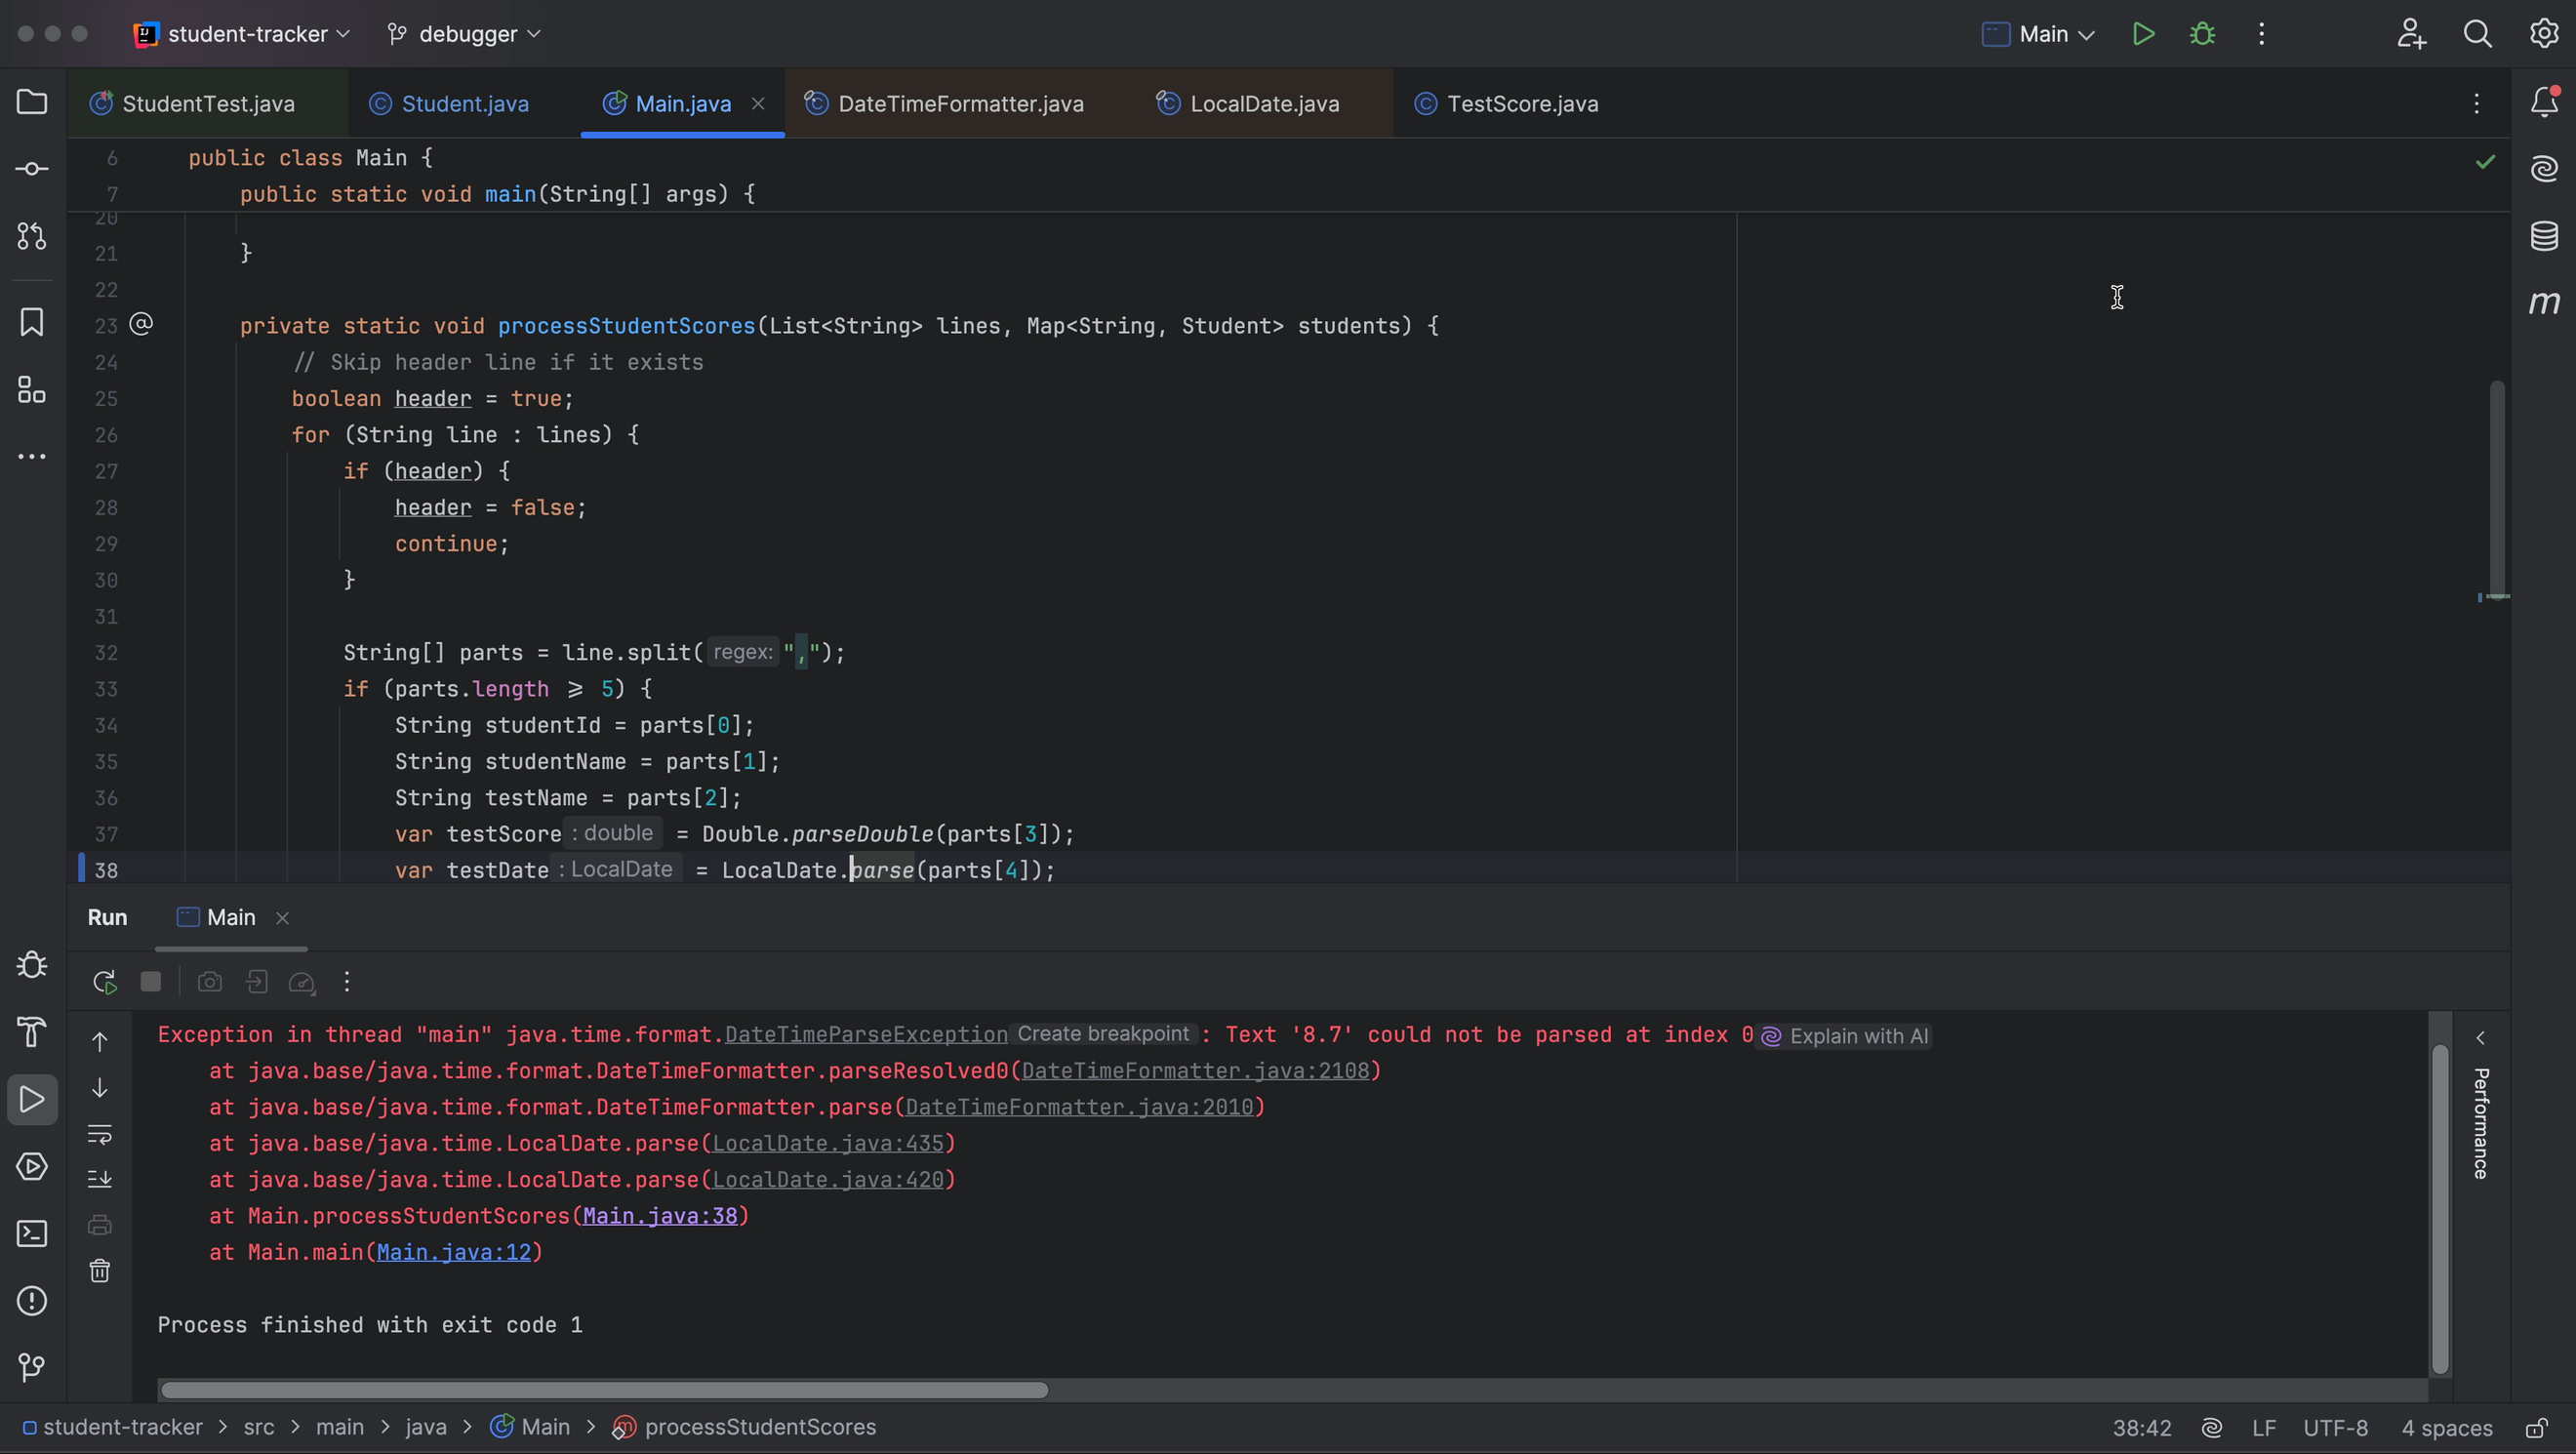
When we run the application, we see that there seems to be another problem! Our application throws a `DateTimeParseException`, with the message `Text ‘8.7’ could not be parsed at index 0`. Let’s use the debugger to find out what’s wrong.
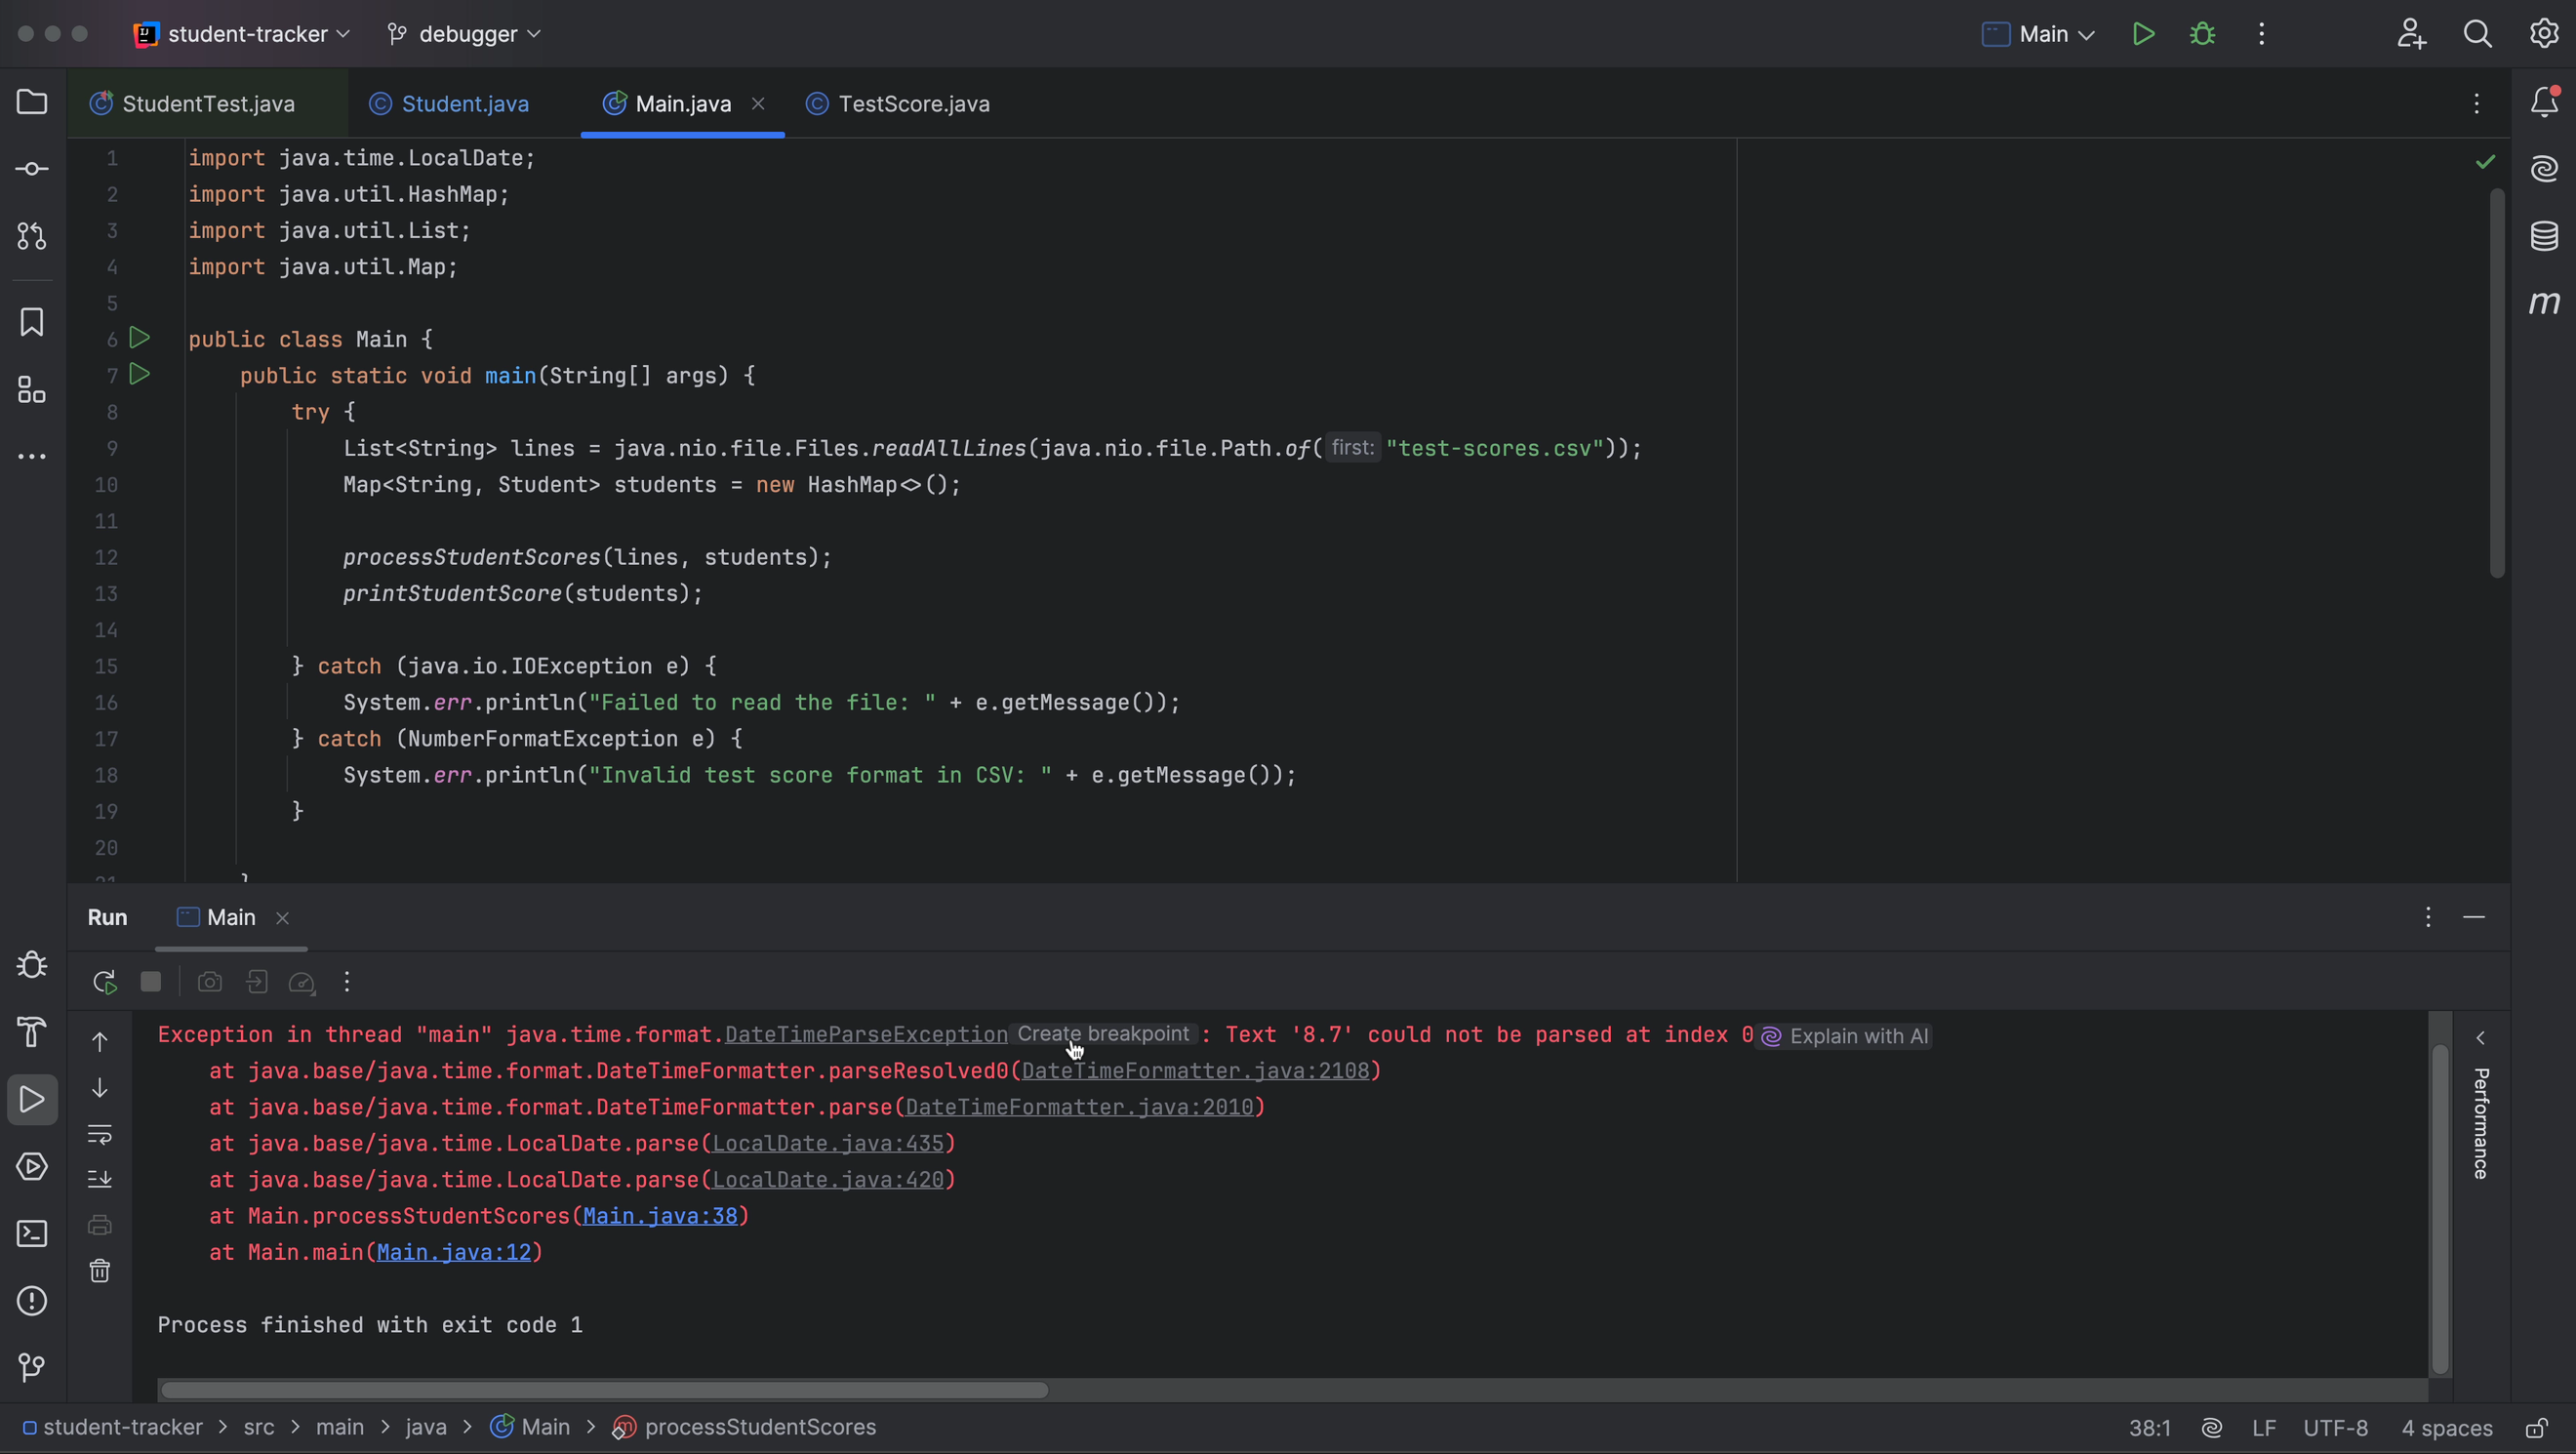
Note that we can create a breakpoint right from the console, by clicking the link Create breakpoint. This opens the Breakpoints dialog, where an Exception Breakpoint has been added for the `DateTimeParseException`.
Now, when we run our application in Debug mode, execution will stop when and where this exception is thrown, so we can figure out what caused it. Execution stops in the `DateTimeFormatter` class. When we expand the `Exception` in the Debug tool window, we see that the `detailMessage` is “Text “8.7” cannot be parsed as a `DateTime`”. That makes sense, as the number 8.7 does not represent a valid date.
Reset frame
To find out where the incorrect value comes from, we can go back in the call stack. The call stack is shown in the left pane of the Debug tool window. We see a round arrow in front of the last method that was called. When we hover over this arrow, we see the option to Reset Frame.
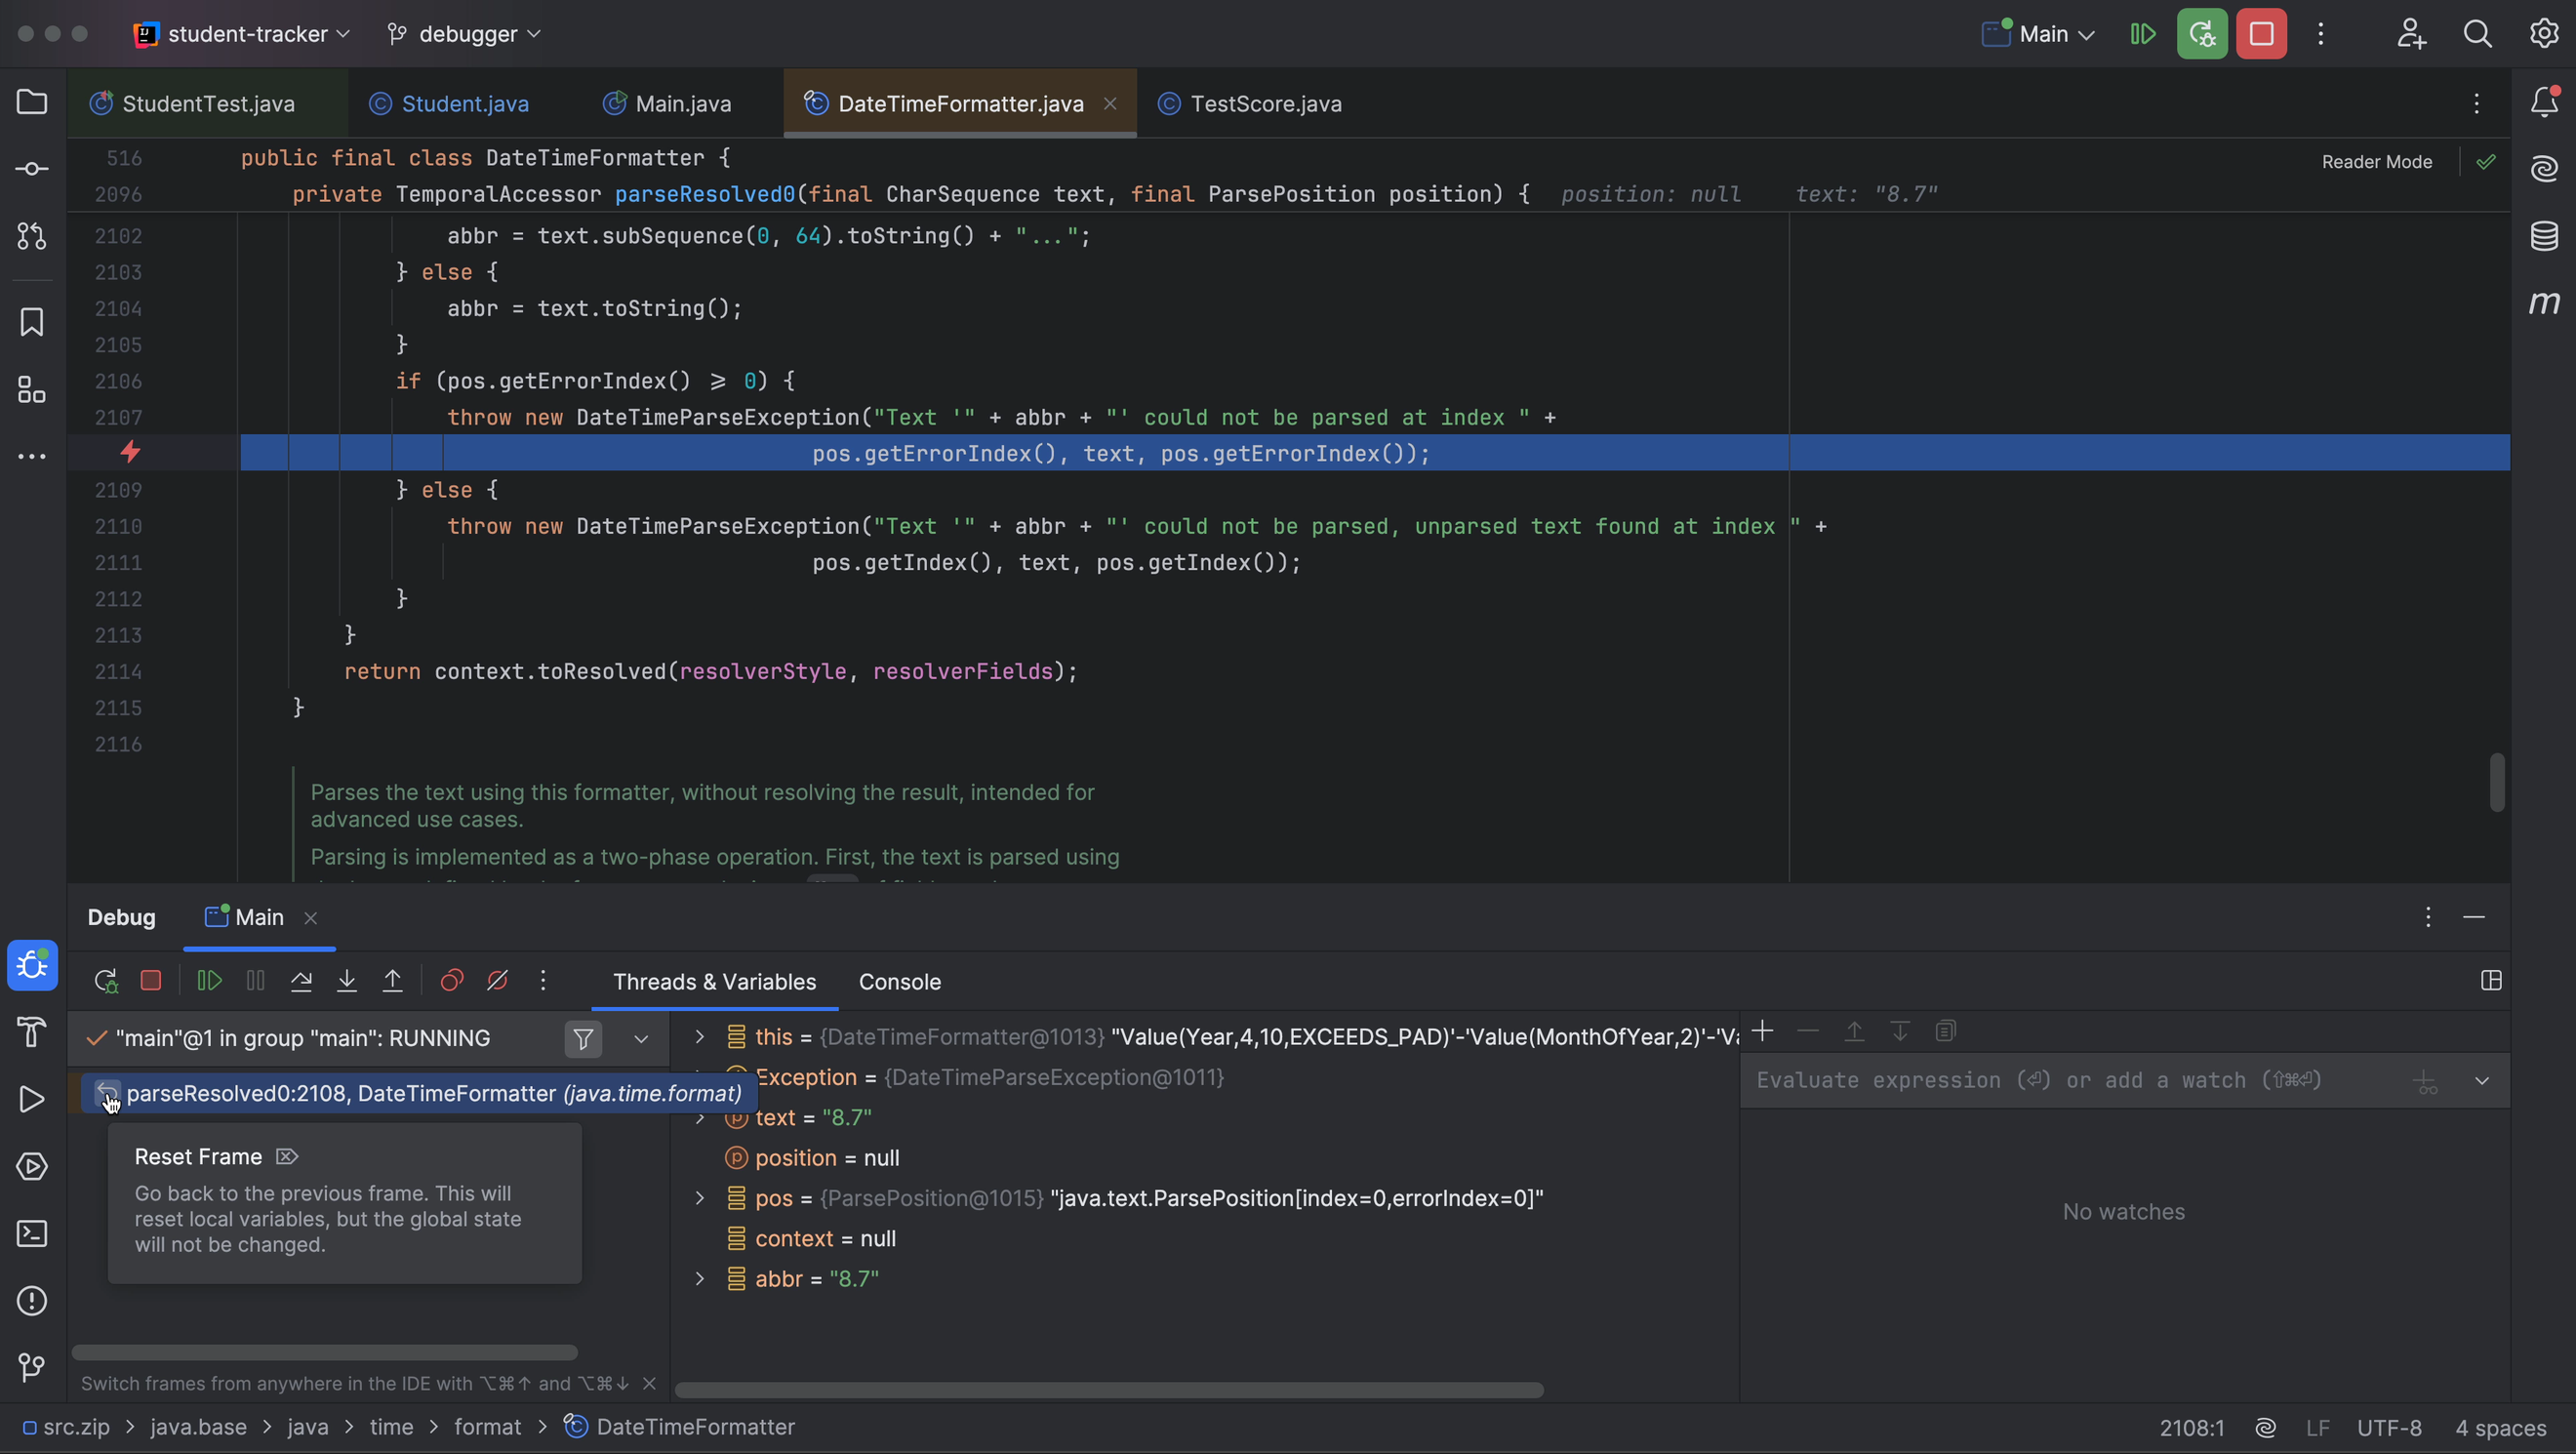
We can use Reset Frame to go back to the previous frame. Let’s do so until we get to the point in our code where we try to parse this value into a date. We will need to drop several frames until we get back to our own code. We see that we try to parse a `LocalDate` on line 38 of our `Main` class.
Note that there are limitations to using Reset Frame; it only resets local variables, not static and instance variables. It also won’t undo any side effects of your application, like console output. While this is not relevant in the current example, you should be aware when you use Reset Frame in the future.
We are trying to parse a part of a line from our CSV file. Each line has been split into parts. To see all parts of the current line, click the View link next to the `parts` variable in the Debug tool window. Here we see that “8.7’ is actually a test score, as you might have guessed. We can also see that the line does contain a date, but it is in the next part of the line.
As we can see in our code, we are parsing the same part of the line (`parts[3]`) twice! This looks like a copy-paste error! We should be parsing the part of the line that contains the date, which is `parts[4]`. Let’s fix that by changing line 38 to `var testDate = LocalDate.parse(parts[4]);`
Note that we could have also gone directly to this line in the code from the console, by clicking the link “Main.java:38” in the console. However, it is useful to know how to set a breakpoint for an exception in case you ever need it.
Print to the console
In fact, while we’re here, let’s make sure that we are parsing all the parts of the lines correctly.
As we can see in the code just above (on line 25), our CSV file contains a header. Let’s print this header to the console to make sure we parse each part of the line to the correct field. We could add a `System.out.println()` to our code to print the header, but we don’t want to risk print statements ending up in production! Fortunately, there is a better way to do so.
Non-suspending logging breakpoint
Let’s create a non-suspending breakpoint, which means that execution will not stop on this breakpoint, and set it to log the line to the console when the breakpoint is hit.
To do so, create a breakpoint on line 27. Right-click the breakpoint and click More to open the Breakpoints dialog. Unselect Suspend to make this a non-suspending breakpoint. Next, select Log and Evaluate & log. Set the Evaluate & log field to `”Header: ” + line` and click Done. Notice that the breakpoint is yellow, to signify that this is a non-suspending breakpoint.
Now, when we run the application in Debug mode, we see that the header is printed to the console. But so are all the other lines from the file. To print only the header, the breakpoint should be on the next line. We could set a new breakpoint there, but then we’d have to redo the configuration…
Drag and drop breakpoint
Instead of creating a new breakpoint, we can drag and drop the existing breakpoint to the next line, preserving its configuration.
Now, when we run the application in Debug mode, only the header is printed to the console. Along with the output of our program, of course. It looks like our fields correspond correctly to the headers of the file.
Checking the functionality of the application
Let’s run our application again to see if everything is now as it should be. We see that the application runs without errors, but it looks like one of the students has a negative average test score.
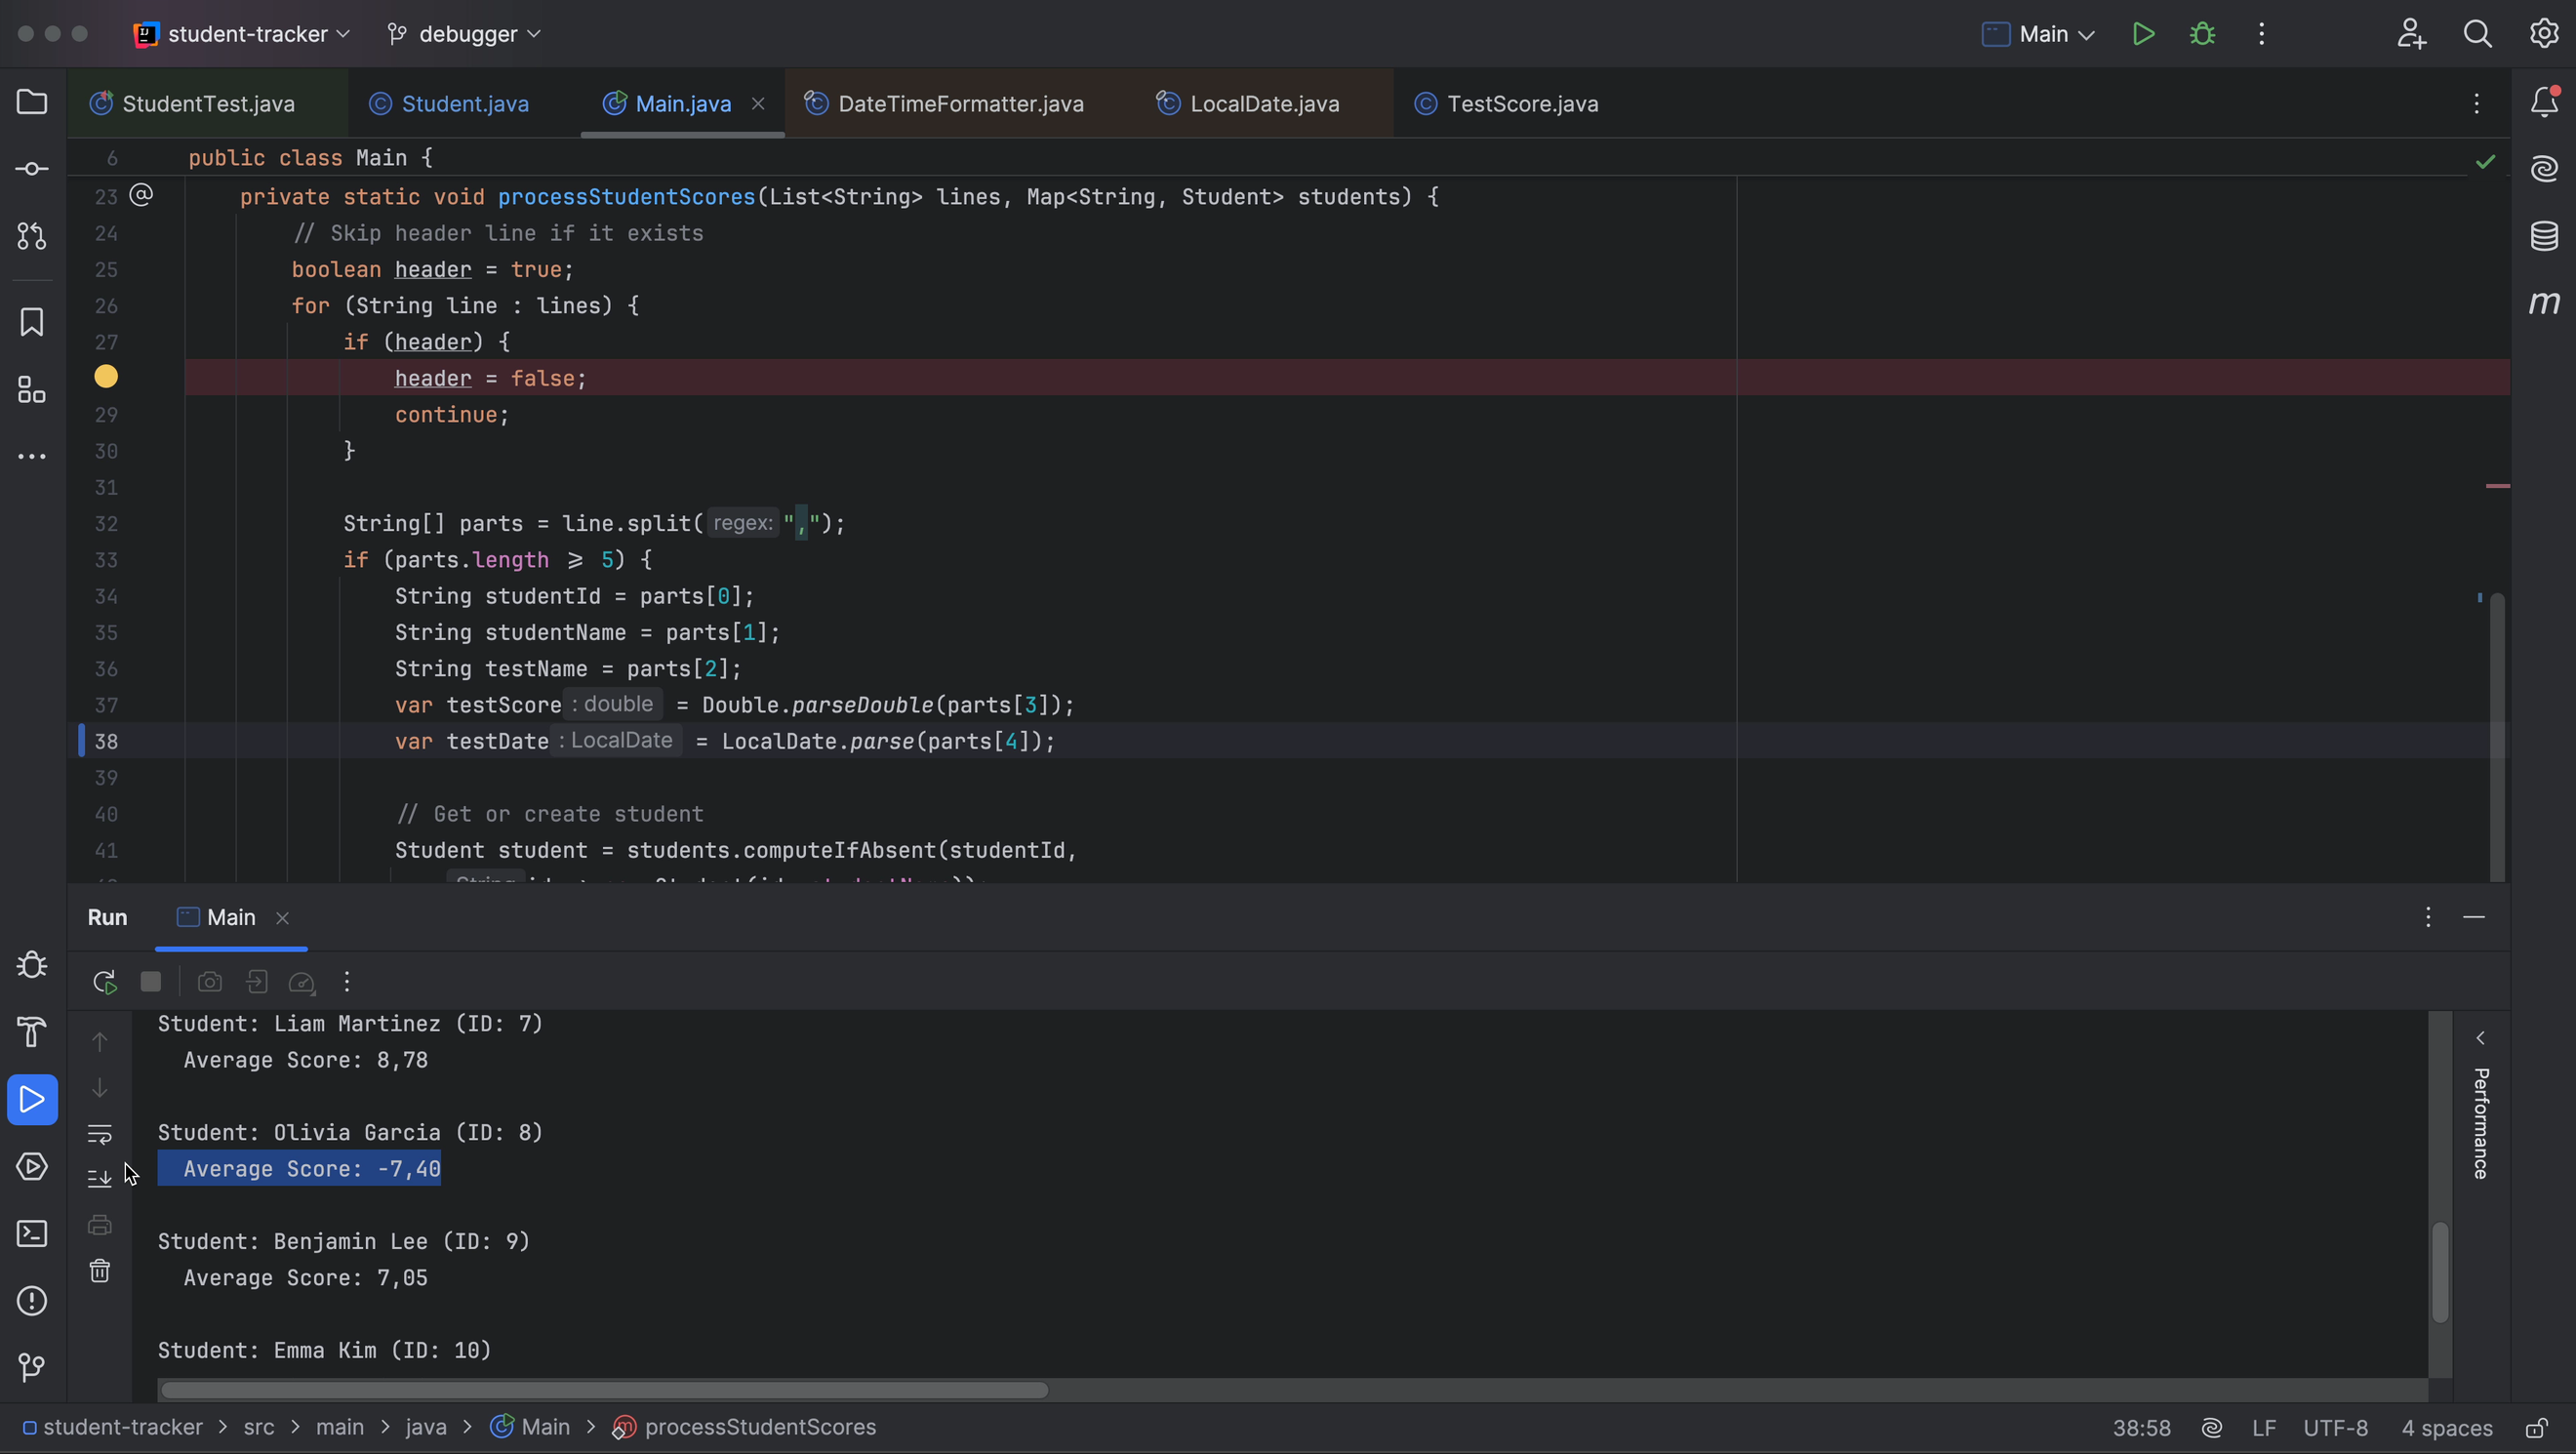
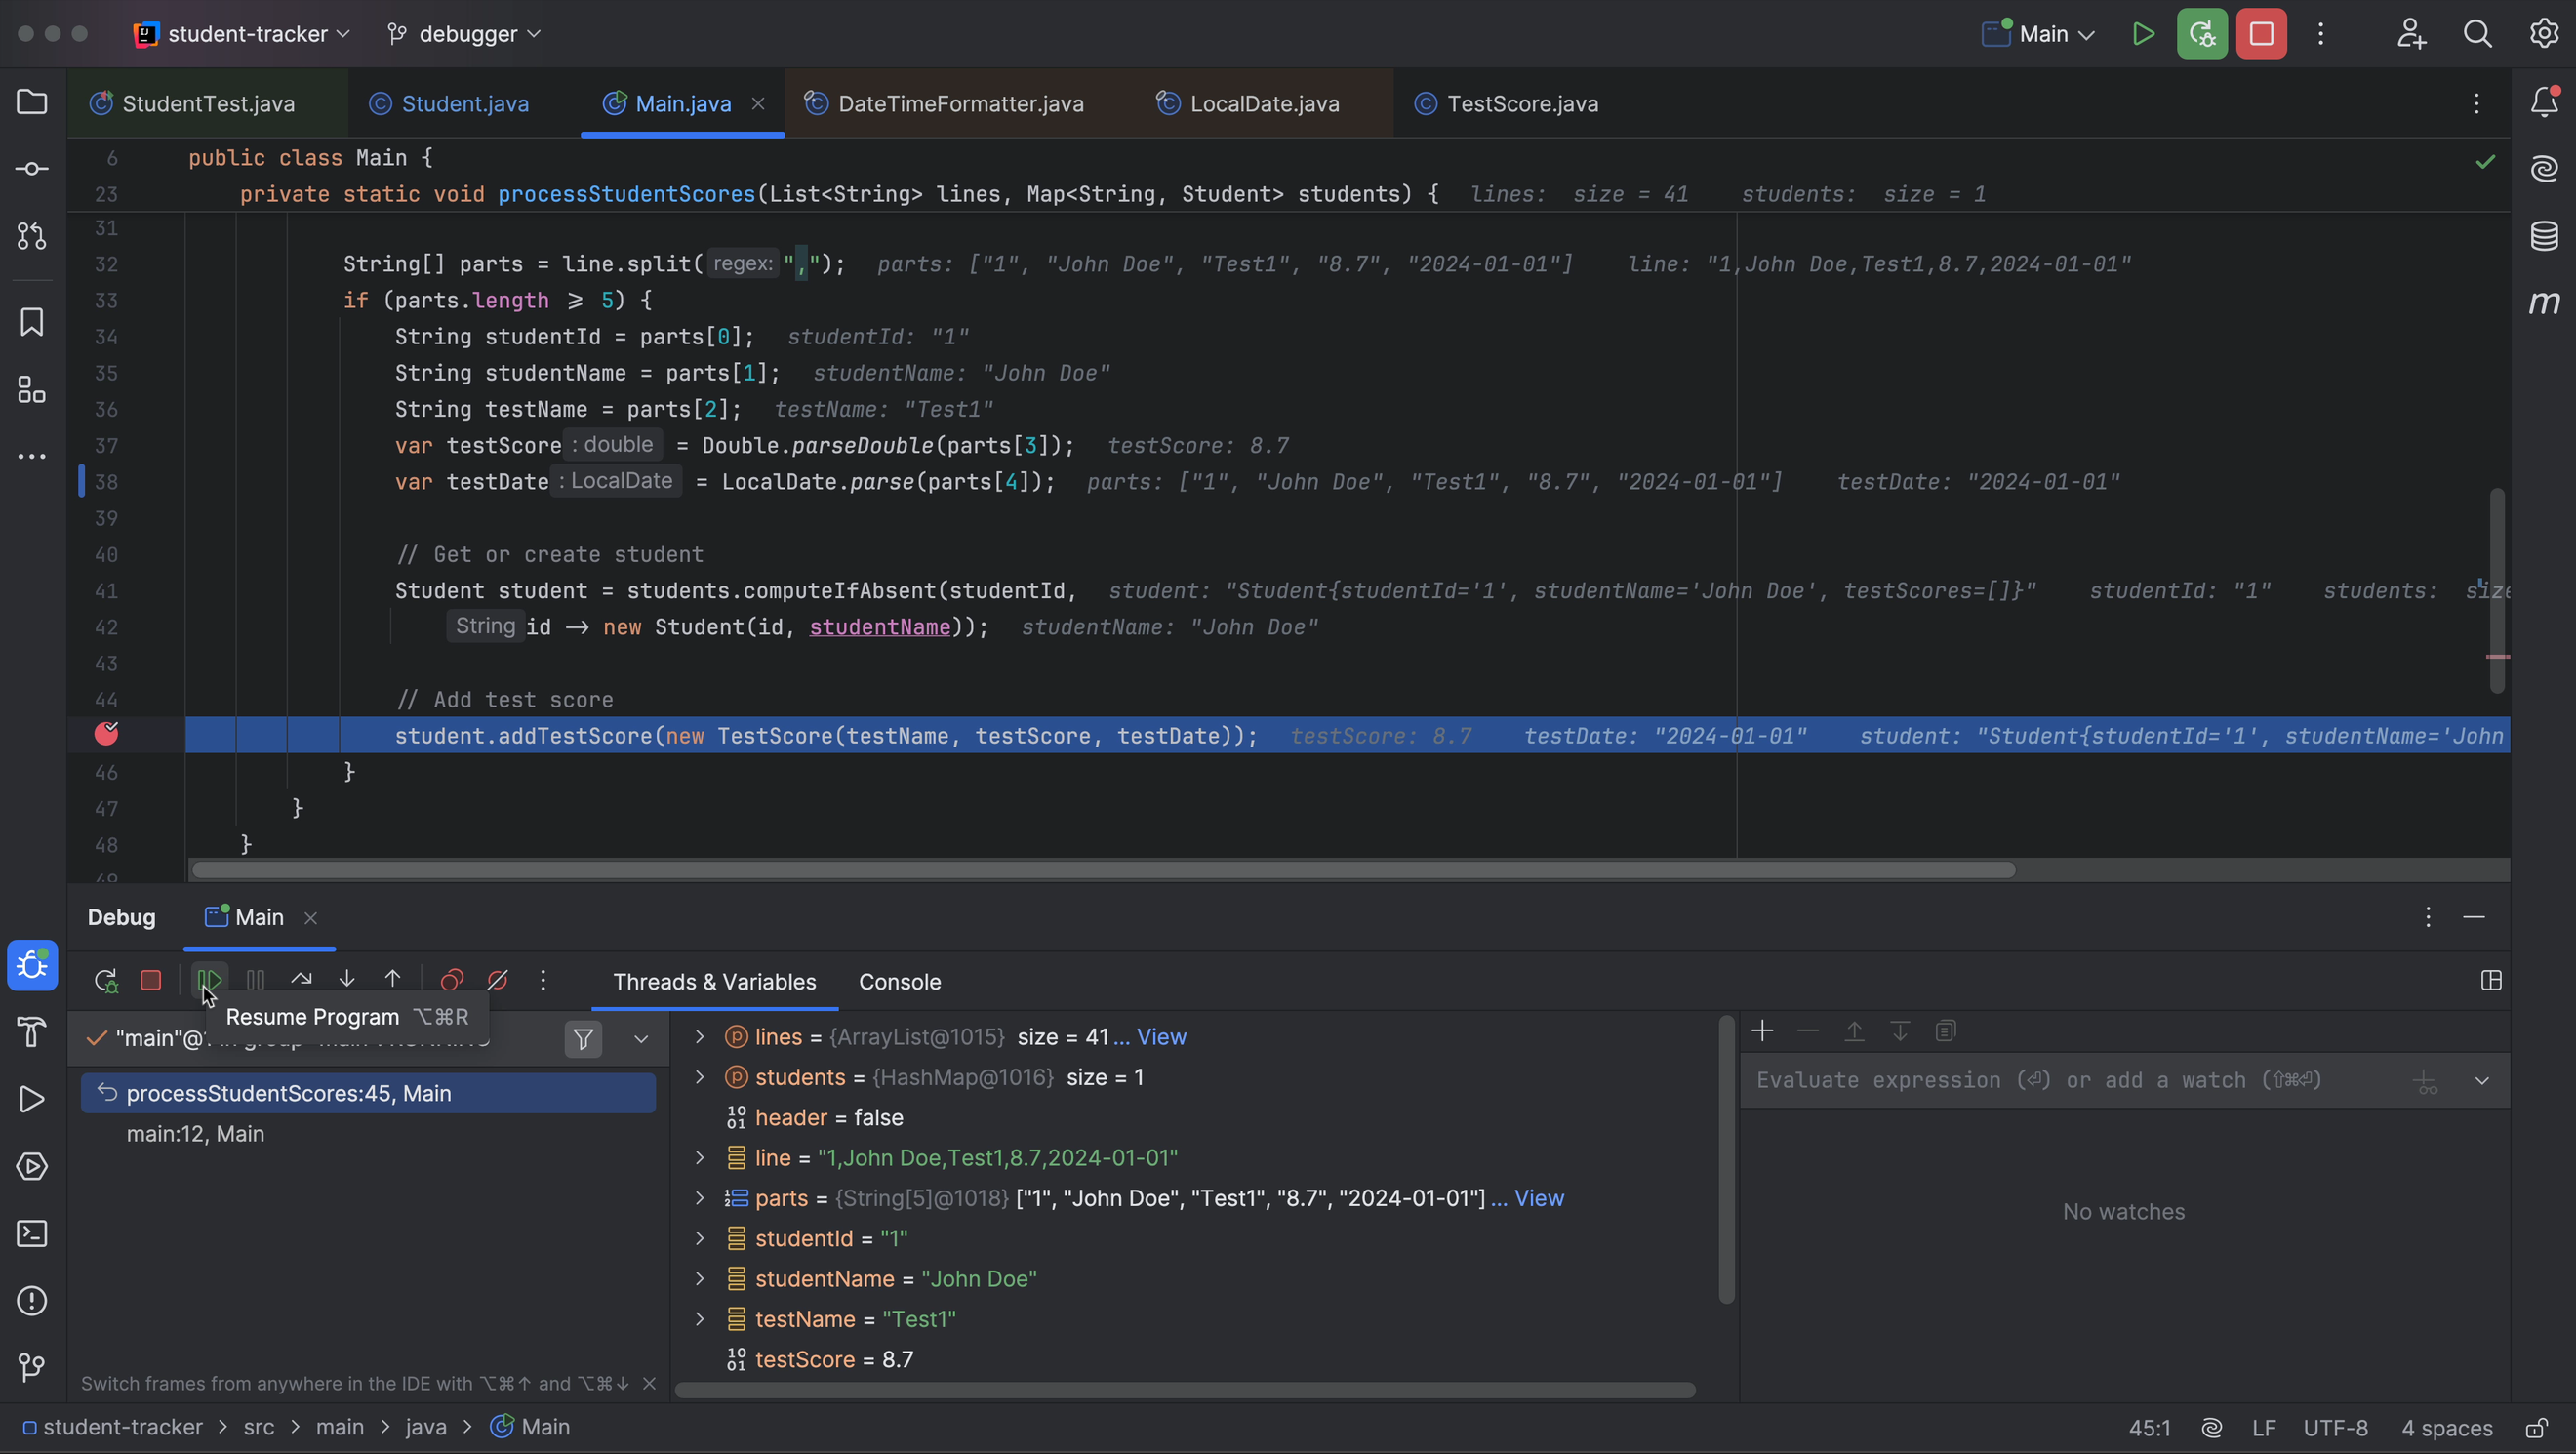
That can’t be right! Let’s see what’s going on. We’ll set a breakpoint in the code where we add test scores to the student (line 45 in `Main.java`). When we run our application in Debug mode, execution will stop every time this breakpoint is hit. We can click the Resume Program button (⌥⌘R on macOS / F9 on Windows/Linux), either in the Debug tool window, or inline in the editor, to get to the next test score.
Every time we click the Resume Program button, we can see the values change both in the inline debugging information in the editor and in the Debug tool window. Execution will stop every time it hits this breakpoint, so for every test score. Since there are a lot of test scores in the file, this is going to take a while…
Conditional breakpoint
As we are only interested in the test scores for a particular student, we don’t need execution to stop for each test score. Instead of clicking the Resume Program button many times in a row to get to the scores we’re interested in, we can use a conditional breakpoint – which will only halt execution under certain conditions.
Right-click the breakpoint to open the Line Breakpoint dialog and edit the configuration for the breakpoint. Since we don’t need execution to suspend until we process this particular student’s test scores, we can set the field Condition to `studentName.equals(“Olivia Garcia”)` and click Done.
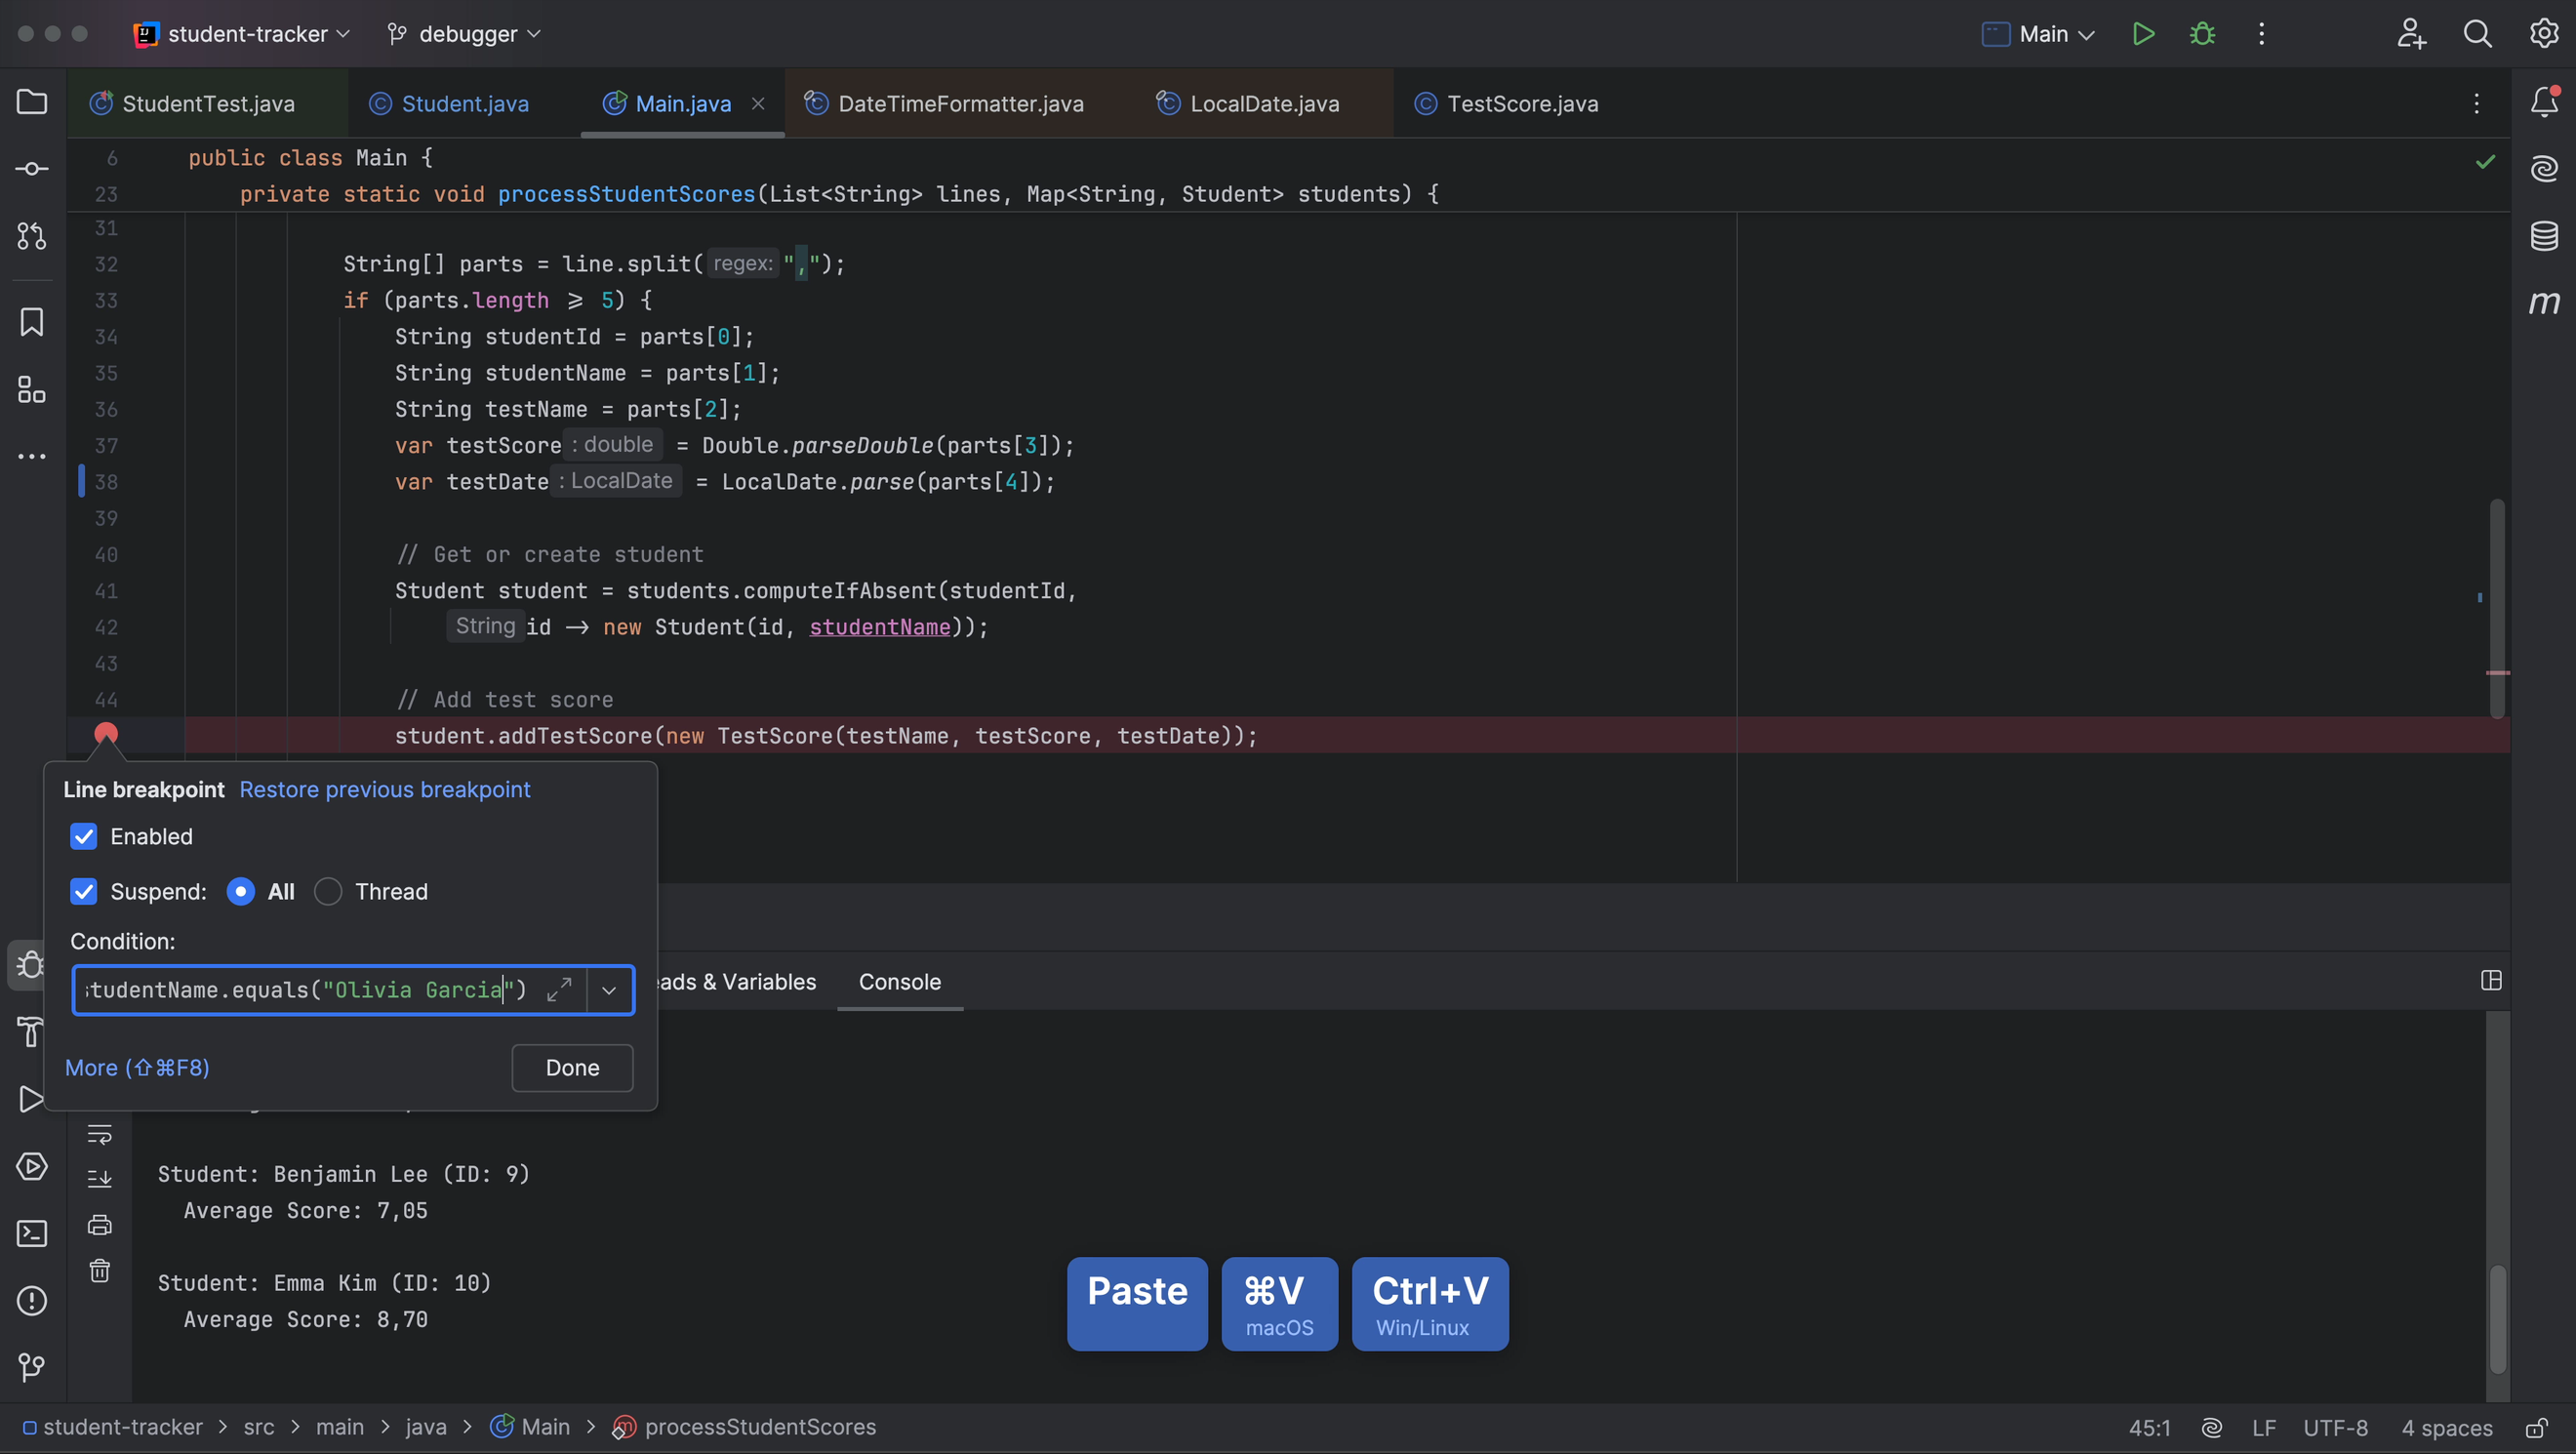
Notice that the breakpoint has a small question mark in it, to signify that it is a conditional breakpoint. Now, when we resume our program, execution will stop only once we get to the test scores for the student whose name we have set in the condition. Here we can see that the test score is negative.

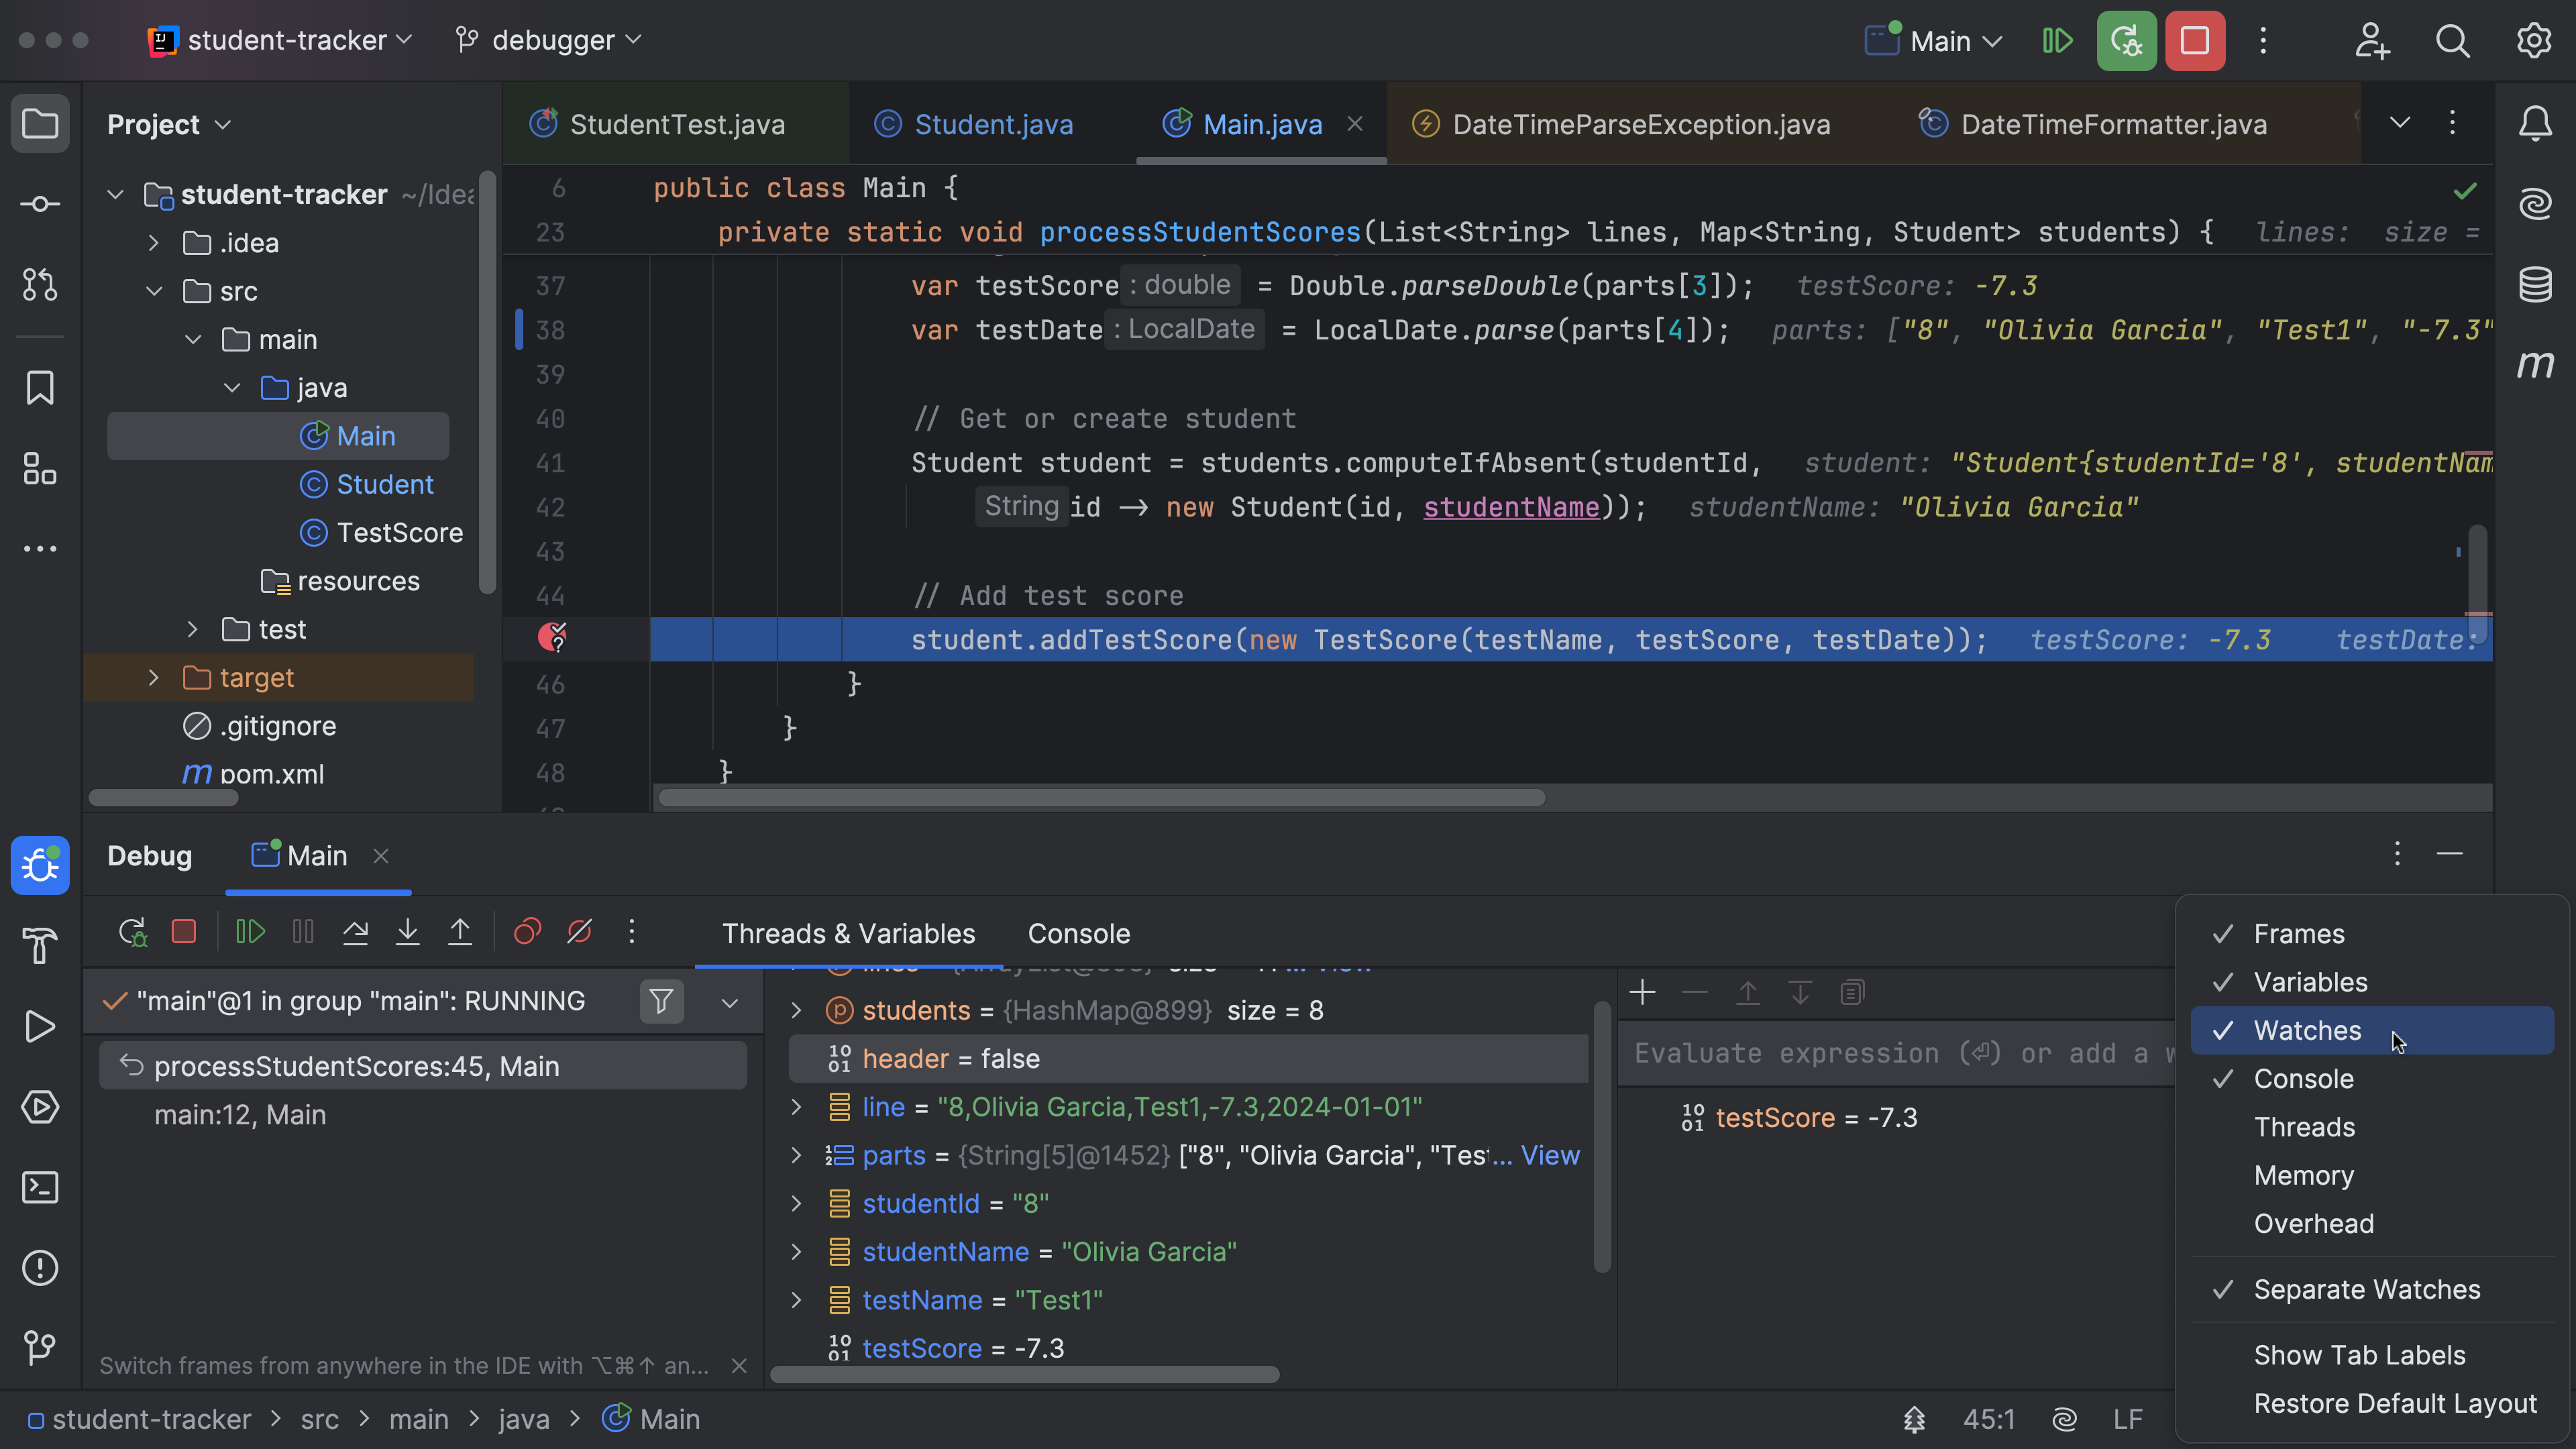
Add watch
To see whether all test scores for this student are negative, let’s add a watch to the field `testScore`. Adding a watch makes it easier to explicitly watch the value of a field. Right-click on the variable `testScore` in the Threads & Variables tab in the Debug tool window and select Add to watches from the context menu. The watch will be shown in the right pane of the Debug tool window.

If needed, select the Layout Settings icon at the top right of the Debug tool window and select Watches in the list, to show watches in the right pane.
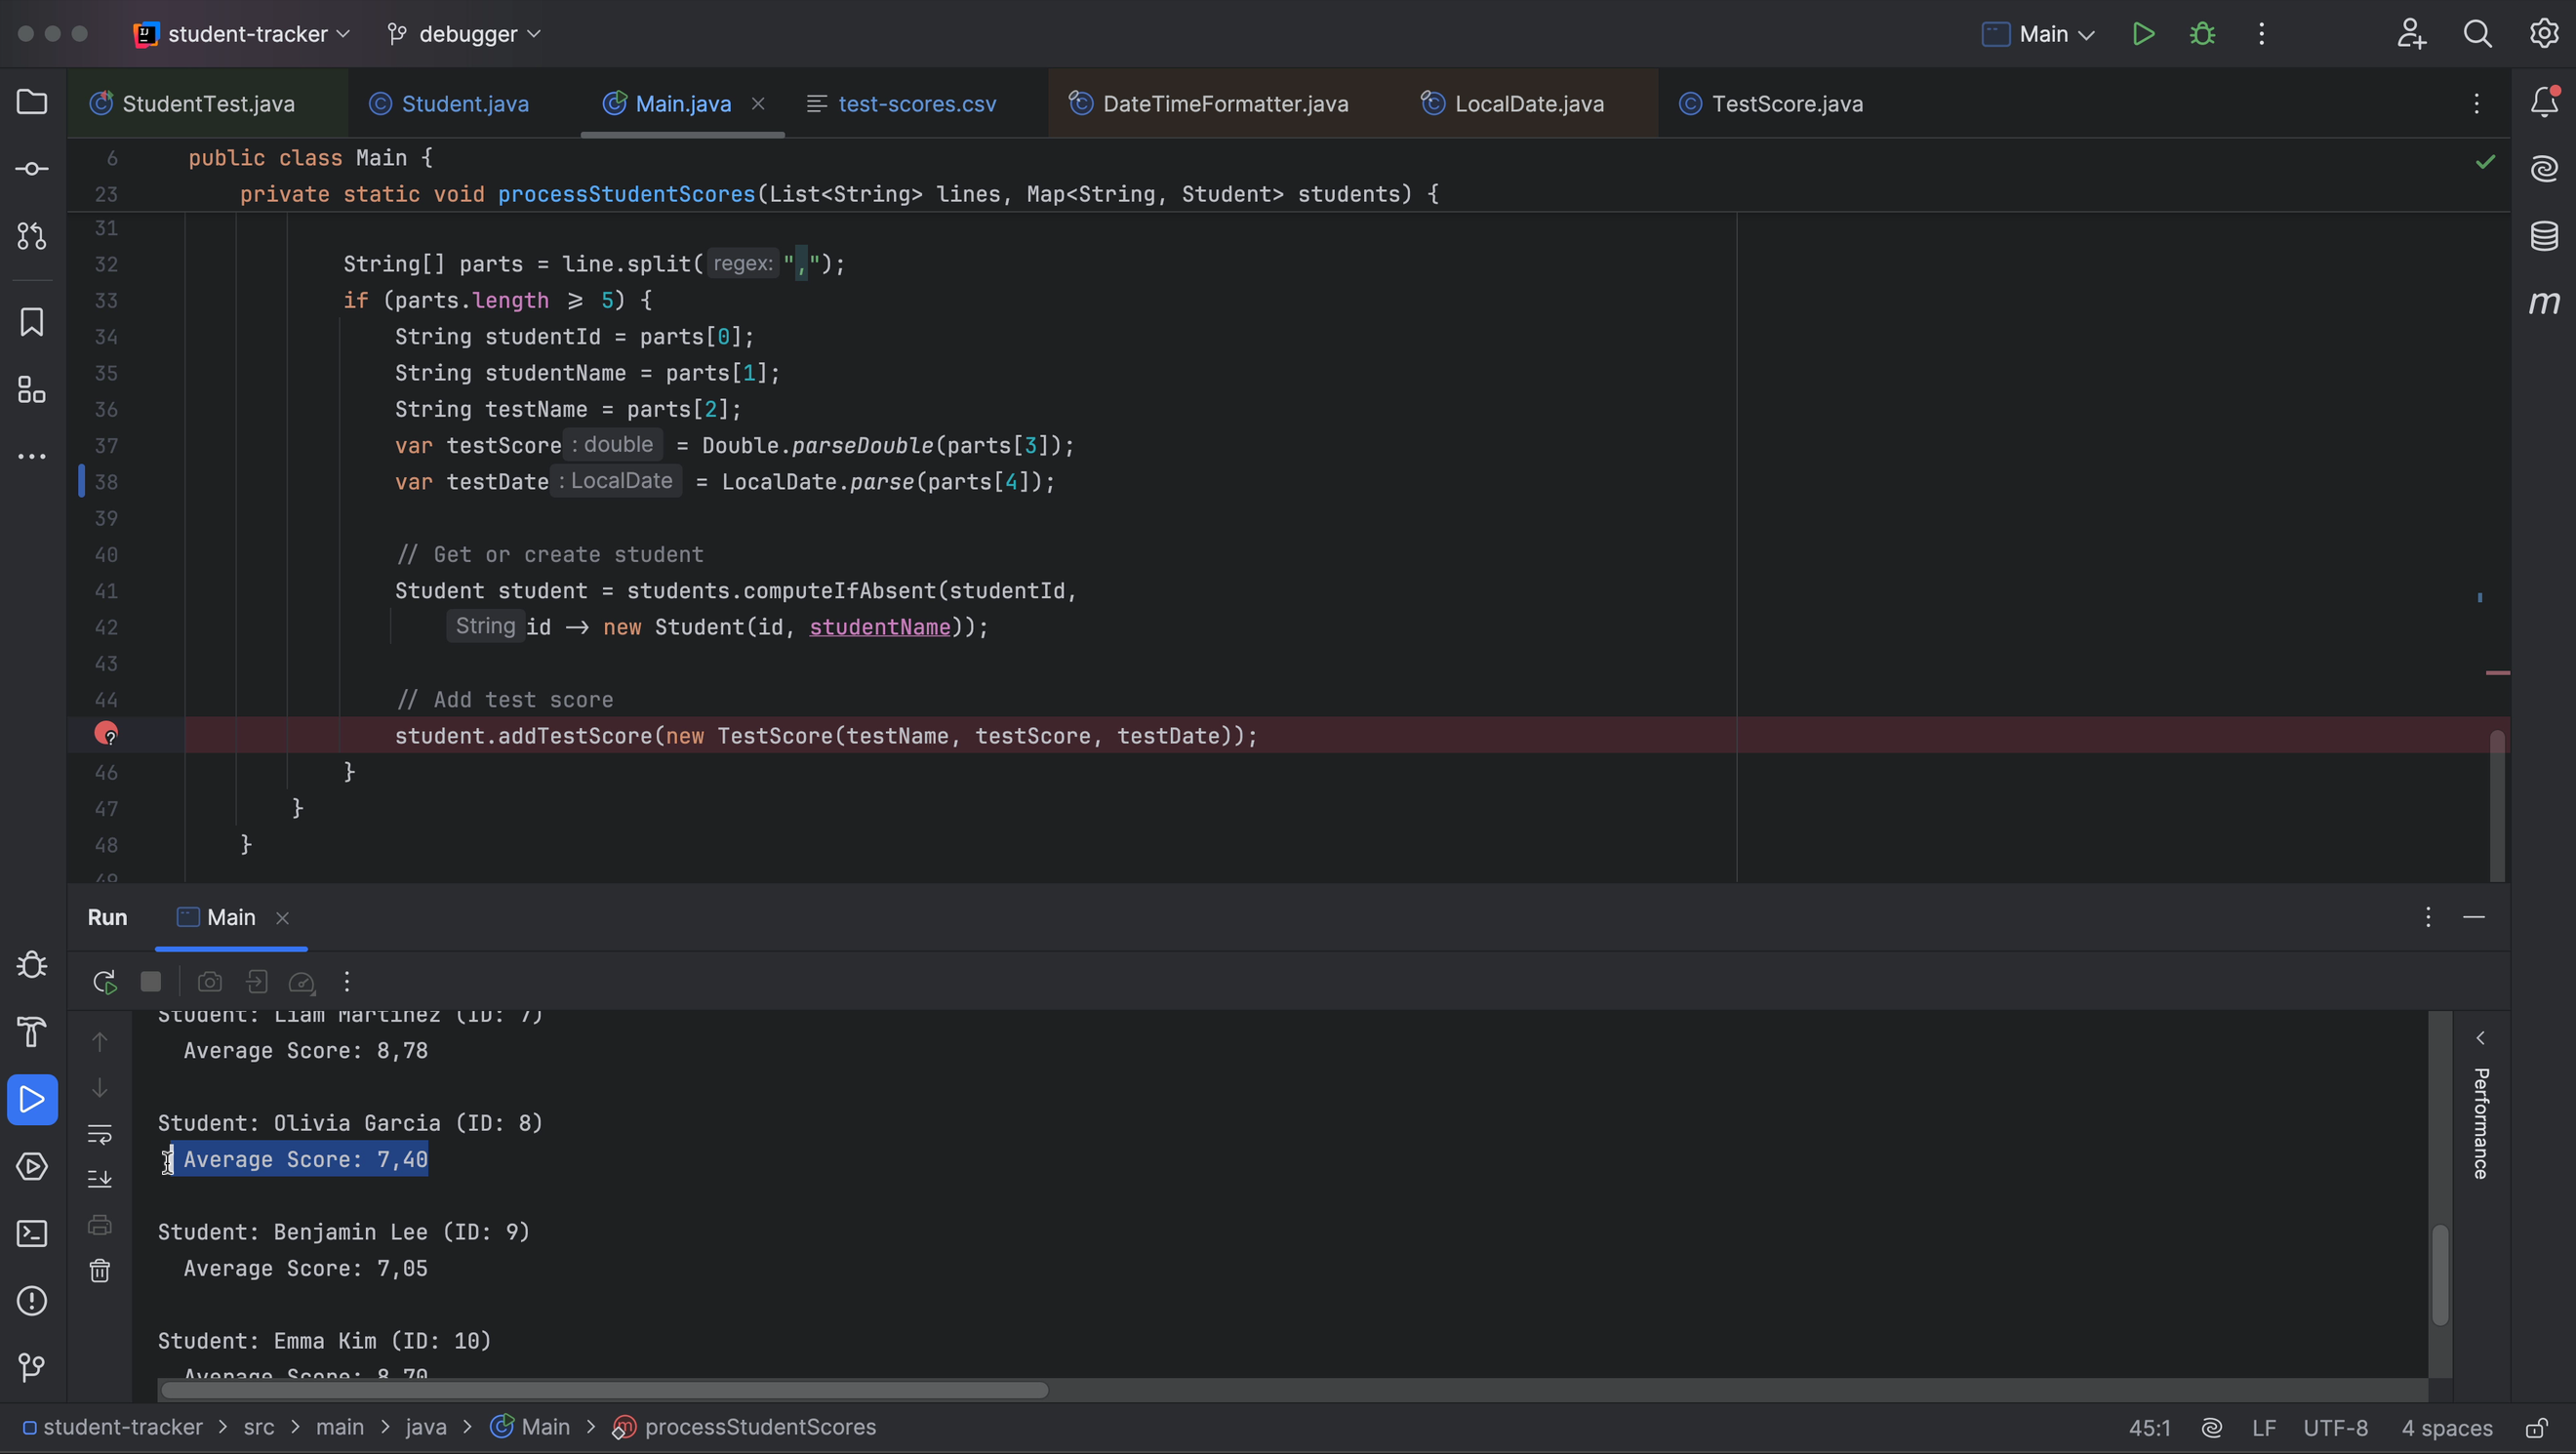
When we click Resume Program and loop over this student’s scores, we see that all her scores are negative. That would explain her negative average…
This looks like a problem with the input data. Let’s open the CSV file to correct the scores and make sure Olivia’s scores are no longer negative. We can use multiple carets to fix all scores at the same time.
In this example, we can fix our input data ourselves. If you are dealing with user input that you can’t change, consider adding validation to the code, for example, that test scores cannot be negative.
Final check
Let’s run our application one more time to see that everything is in order. We see that average scores are printed to the console for all students, and none of the scores are negative. This is how our application is expected to work.
Conclusion
In this blog post, we’ve seen how to use the debugger to find and fix several types of bugs, from problems with the logic in the code, to reasons that exceptions are thrown, and finding problems with input data.
Is there anything else you’d like to learn about the debugger? Please tell us in the comments!