


![Apple to Craft Key Foldable iPhone Components From Liquid Metal [Kuo]](https://www.iclarified.com/images/news/96784/96784/96784-640.jpg)

![Apple to Focus on Battery Life and Power Efficiency in Future Premium Devices [Rumor]](https://www.iclarified.com/images/news/96781/96781/96781-640.jpg)


_Federico_Caputo_Alamy.jpg?#)


![[The AI Show Episode 139]: The Government Knows AGI Is Coming, Superintelligence Strategy, OpenAI’s $20,000 Per Month Agents & Top 100 Gen AI Apps](https://www.marketingaiinstitute.com/hubfs/ep%20139%20cover-2.png)


![[The AI Show Episode 138]: Introducing GPT-4.5, Claude 3.7 Sonnet, Alexa+, Deep Research Now in ChatGPT Plus & How AI Is Disrupting Writing](https://www.marketingaiinstitute.com/hubfs/ep%20138%20cover.png)


.jpg?width=1920&height=1920&fit=bounds&quality=80&format=jpg&auto=webp#)


Published an OSS Repository That Continuously Stores GitHub Repository Metrics Using GAS
Hey Devs! Previously, I explored how we can monitor OSS activity metrics based on GitHub repository data. Consideration of OSS Activity Metrics Based on GitHub Repository Data Takashi Masuda for ROUTE06, Inc. ・ Dec 16 '24 #ospo #opensource #github #marketing Building on that, I implemented a Google Apps Script (GAS) that continuously stores traffic data from GitHub repositories. Continuously Storing Traffic Data of Multiple GitHub Repositories Using GAS Takashi Masuda for ROUTE06, Inc. ・ Dec 23 '24 #github #googlesheets #googleappsscript This time, while adding GAS functions to store other metrics, I have published the repository as OSS. I’d like to take this opportunity to introduce it once again. Published Repository Stored Metrics 1. Stargazers Objectives Issues Solution 2. Traffic views Objectives Issues Solution 3. Traffic clones Objectives Issues Solution 4. Top referral sources Objectives Issues Solution Conclusion Published Repository The published repository is available here. route06inc / ospo-google-apps-script OSPO Google Apps Script by ROUTE06, Inc. The initial setup is summarized in the README. I will focus mainly on why I decided to store these metrics. Stored Metrics 1. Stargazers Objectives To understand the daily increase in stars. To correlate the days with star increases with possible reasons or initiatives. Issues On GitHub’s web UI, only the total number of stars and the accounts that starred are visible. Example: https://github.com/giselles-ai/giselle/stargazers With Star History, the counts for nearby days are rounded off, and it does not allow for note-taking. Example: https://www.star-history.com/#giselles-ai/giselle&Date Solution I implemented the function updateSheetWithStargazers to record who starred on which day. The graph was created as shown below. The key is to enable “Aggregate” on the X-axis. Except for the colored cells, you can freely add notes. 2. Traffic views Objectives To permanently store the numerical data from the Visitors graph in the repository’s Insights > Traffic section. https://github.com/[ORG]/[REPO]/graphs/traffic Issues The graph does not display data older than two weeks. The GitHub REST API Get traffic views has the same limitation. Solution I implemented the function updateSheetWithLatestTrafficViews that uses this API to store the daily Views and Unique visitors in a spreadsheet. 3. Traffic clones Objectives To permanently store the numerical data from the Git clones graph in the repository’s Insights > Traffic section. https://github.com/[ORG]/[REPO]/graphs/traffic Issues The graph does not display data older than two weeks. The GitHub REST API Get traffic clones has the same limitation. Solution I implemented the function updateSheetWithLatestTrafficClones that uses this API to store the daily Clones and Unique cloners in a spreadsheet. 4. Top referral sources Objectives To permanently store the numerical data from the Referring sites graph in the repository’s Insights > Traffic section. https://github.com/[ORG]/[REPO]/graphs/traffic Issues The graph does not display data older than two weeks. The GitHub REST API Get top referral sources has the same limitation. Each value is the total for the past 14 days, which is not very user-friendly. Solution I implemented the function updateSheetWithLatestTrafficReferrers using this API to store the daily Referring sites in a spreadsheet. To create a stacked graph, I made a pivot table of Views and Unique visitors on a separate sheet, along with their respective graphs. While the issue of each value being a total for the past 14 days remains unsolved, it seems possible to separate them using spreadsheet functions. Conclusion I have published the OSS repository https://github.com/route06inc/ospo-google-apps-script that continuously stores GitHub repository metrics using GAS. This tool is already in daily use on the repositories of Giselle and Liam, and the data is being effectively utilized. https://github.com/giselles-ai/giselle https://github.com/liam-hq/liam

Hey Devs!
Previously, I explored how we can monitor OSS activity metrics based on GitHub repository data.

Building on that, I implemented a Google Apps Script (GAS) that continuously stores traffic data from GitHub repositories.
This time, while adding GAS functions to store other metrics, I have published the repository as OSS. I’d like to take this opportunity to introduce it once again.
- Published Repository
-
Stored Metrics
-
1. Stargazers
- Objectives
- Issues
- Solution
-
2. Traffic views
- Objectives
- Issues
- Solution
-
3. Traffic clones
- Objectives
- Issues
- Solution
-
4. Top referral sources
- Objectives
- Issues
- Solution
-
1. Stargazers
- Conclusion
Published Repository
The published repository is available here.
 route06inc
/
ospo-google-apps-script
route06inc
/
ospo-google-apps-script
OSPO Google Apps Script by ROUTE06, Inc.
The initial setup is summarized in the README. I will focus mainly on why I decided to store these metrics.
Stored Metrics
1. Stargazers
Objectives
- To understand the daily increase in stars.
- To correlate the days with star increases with possible reasons or initiatives.
Issues
- On GitHub’s web UI, only the total number of stars and the accounts that starred are visible.
- With Star History, the counts for nearby days are rounded off, and it does not allow for note-taking.
Solution
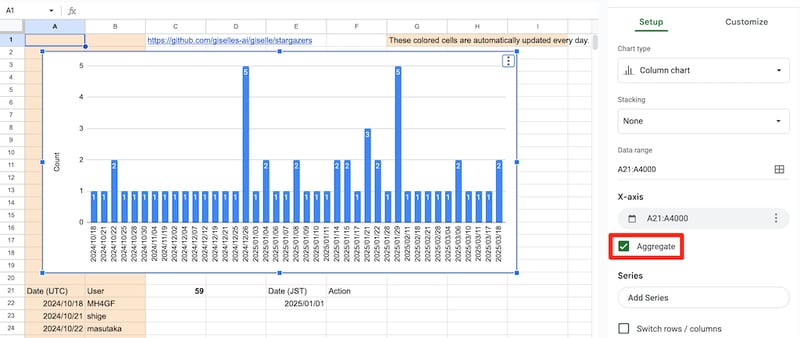
I implemented the function updateSheetWithStargazers to record who starred on which day.
The graph was created as shown below. The key is to enable “Aggregate” on the X-axis. Except for the colored cells, you can freely add notes.
2. Traffic views
Objectives
- To permanently store the numerical data from the
Visitorsgraph in the repository’sInsights > Trafficsection.https://github.com/[ORG]/[REPO]/graphs/traffic
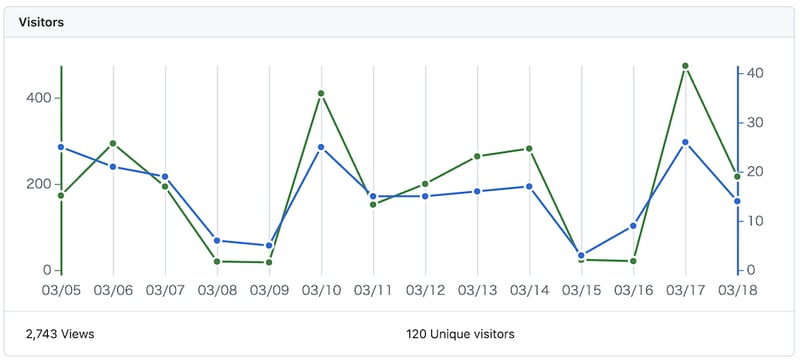
Issues
- The graph does not display data older than two weeks.
- The GitHub REST API Get traffic views has the same limitation.
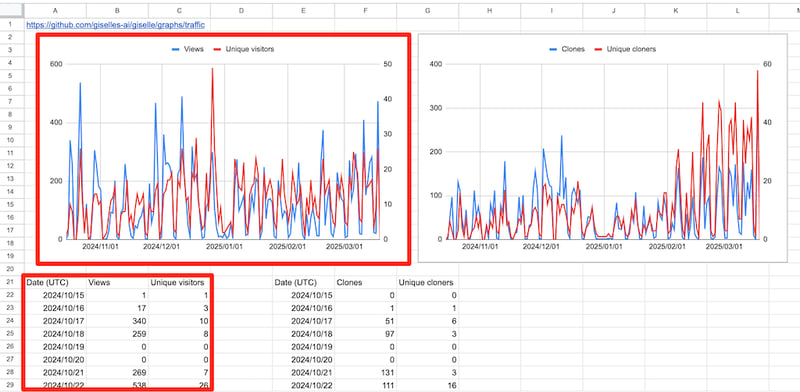
Solution
I implemented the function updateSheetWithLatestTrafficViews that uses this API to store the daily Views and Unique visitors in a spreadsheet.
3. Traffic clones
Objectives
- To permanently store the numerical data from the
Git clonesgraph in the repository’sInsights > Trafficsection.https://github.com/[ORG]/[REPO]/graphs/traffic
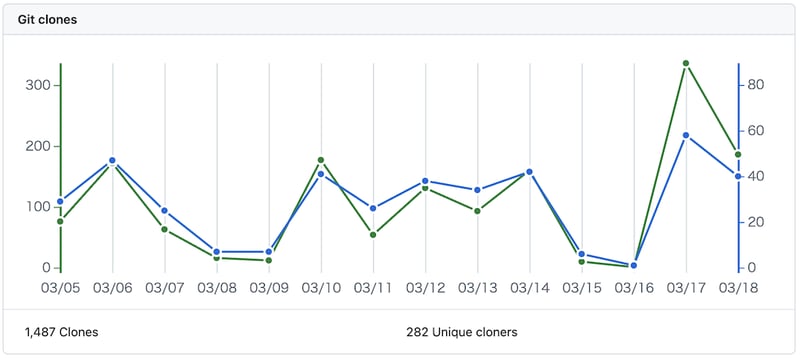
Issues
- The graph does not display data older than two weeks.
- The GitHub REST API Get traffic clones has the same limitation.
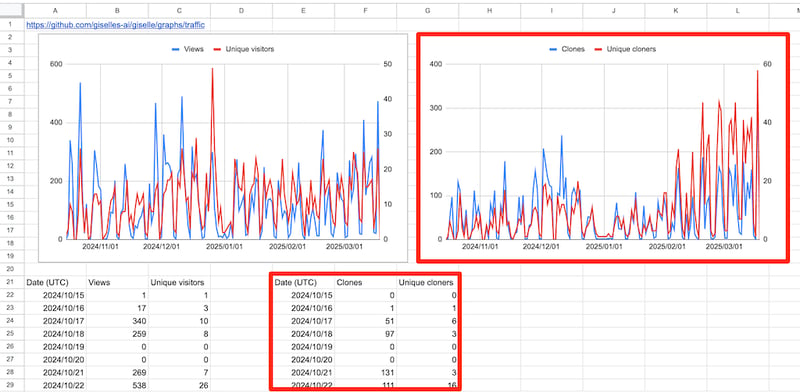
Solution
I implemented the function updateSheetWithLatestTrafficClones that uses this API to store the daily Clones and Unique cloners in a spreadsheet.
4. Top referral sources
Objectives
- To permanently store the numerical data from the
Referring sitesgraph in the repository’sInsights > Trafficsection.https://github.com/[ORG]/[REPO]/graphs/traffic
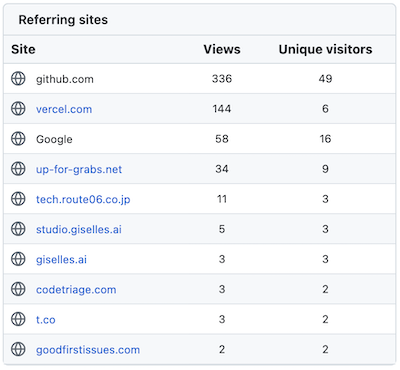
Issues
- The graph does not display data older than two weeks.
- The GitHub REST API Get top referral sources has the same limitation.
- Each value is the total for the past 14 days, which is not very user-friendly.
Solution
I implemented the function updateSheetWithLatestTrafficReferrers using this API to store the daily Referring sites in a spreadsheet.
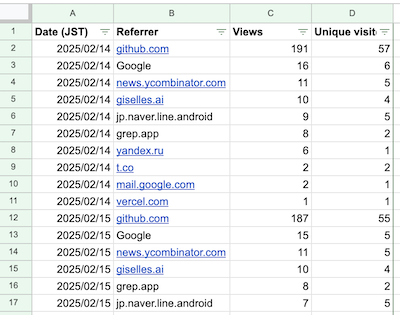
To create a stacked graph, I made a pivot table of Views and Unique visitors on a separate sheet, along with their respective graphs.
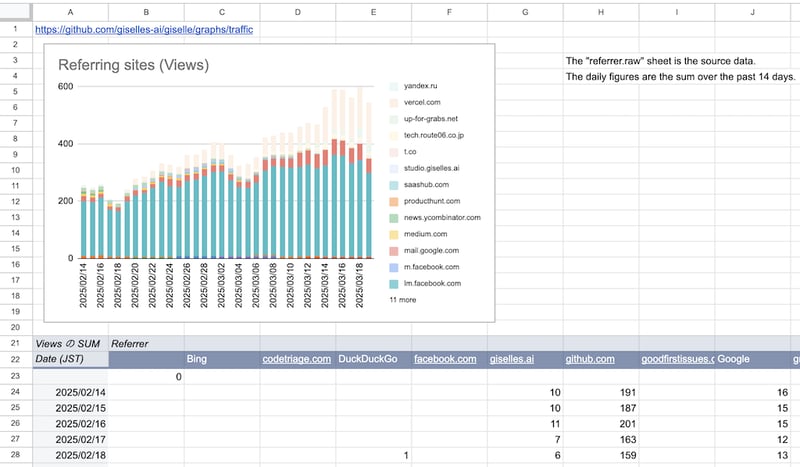
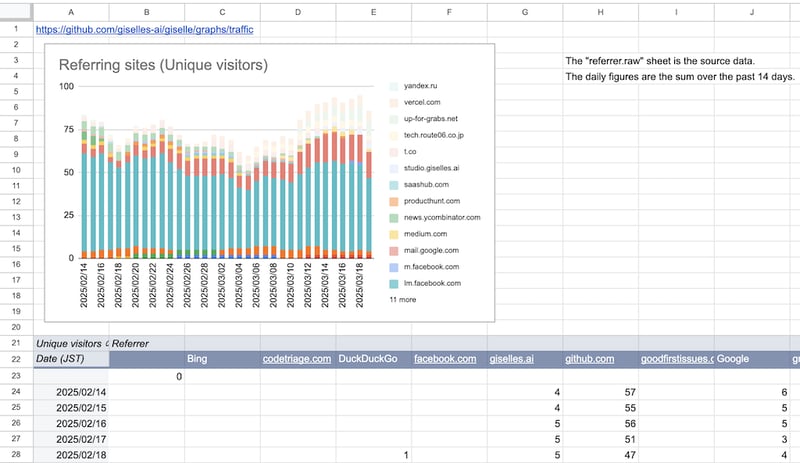
While the issue of each value being a total for the past 14 days remains unsolved, it seems possible to separate them using spreadsheet functions.
Conclusion
I have published the OSS repository https://github.com/route06inc/ospo-google-apps-script that continuously stores GitHub repository metrics using GAS.
This tool is already in daily use on the repositories of Giselle and Liam, and the data is being effectively utilized.