


![Apple Releases New Beta Firmware for AirPods Pro 2 and AirPods 4 [8A293c]](https://www.iclarified.com/images/news/97704/97704/97704-640.jpg)


![Samsung teasing Galaxy Buds ‘Core’ ahead of launch later this week [Gallery]](https://i0.wp.com/9to5google.com/wp-content/uploads/sites/4/2023/10/samsung-galaxy-buds-fe-5.jpg?resize=1200%2C628&quality=82&strip=all&ssl=1)


_ArtemisDiana_Alamy.jpg?width=1280&auto=webp&quality=80&disable=upscale#)


![[The AI Show Episode 155]: The New Jobs AI Will Create, Amazon CEO: AI Will Cut Jobs, Your Brain on ChatGPT, Possible OpenAI-Microsoft Breakup & Veo 3 IP Issues](https://www.marketingaiinstitute.com/hubfs/ep%20155%20cover.png)


.png?width=1920&height=1920&fit=bounds&quality=70&format=jpg&auto=webp#)


Demystifying Spring Boot With Spring Debugger
Spring Boot is a marvel of developer productivity. It hides the plumbing and gets you up and running fast. Components are “miraculously” autowired, properties are “magically” resolved, and database connections materialize seemingly without explicit configuration. But when something goes wrong, the magic becomes a mystery, and debugging becomes a deep dive into the framework’s internal […]
Spring Boot is a marvel of developer productivity. It hides the plumbing and gets you up and running fast. Components are “miraculously” autowired, properties are “magically” resolved, and database connections materialize seemingly without explicit configuration.
But when something goes wrong, the magic becomes a mystery, and debugging becomes a deep dive into the framework’s internal mechanics.
Regular debuggers handle plain Java classes and objects, lacking framework-specific context. To inspect a property, track a bean, or examine an entity state, you need to dig into the internals of Spring Boot. (Remember how to access the application context from the debugger evaluator? Neither do we.)
The rabbit was always in the hat – you just had to know where to look. IntelliJ IDEA has long allowed you to inspect loaded beans or trace the source of a property value using the debugger, but doing so wasn’t exactly straightforward. Our goal is to change that – to make debugging Spring applications as comfortable and productive as the rest of your development experience in IntelliJ IDEA. The first step was an additional structure view, and now we’re going further.
Let’s pull back the curtain on the Spring Boot magic and see how the Spring Debugger plugin makes the invisible visible.
The bean that wasn’t there
Spring Debugger is built with a focus on real-world tasks, helping you uncover what’s really happening inside your Spring application.
You’ve written the class. You’ve annotated it as a bean. But it’s not doing anything.
Maybe it’s not in the right package. Maybe it’s excluded by a conditional. Maybe it’s overridden in a test.
Spring Debugger exposes the full bean landscape:
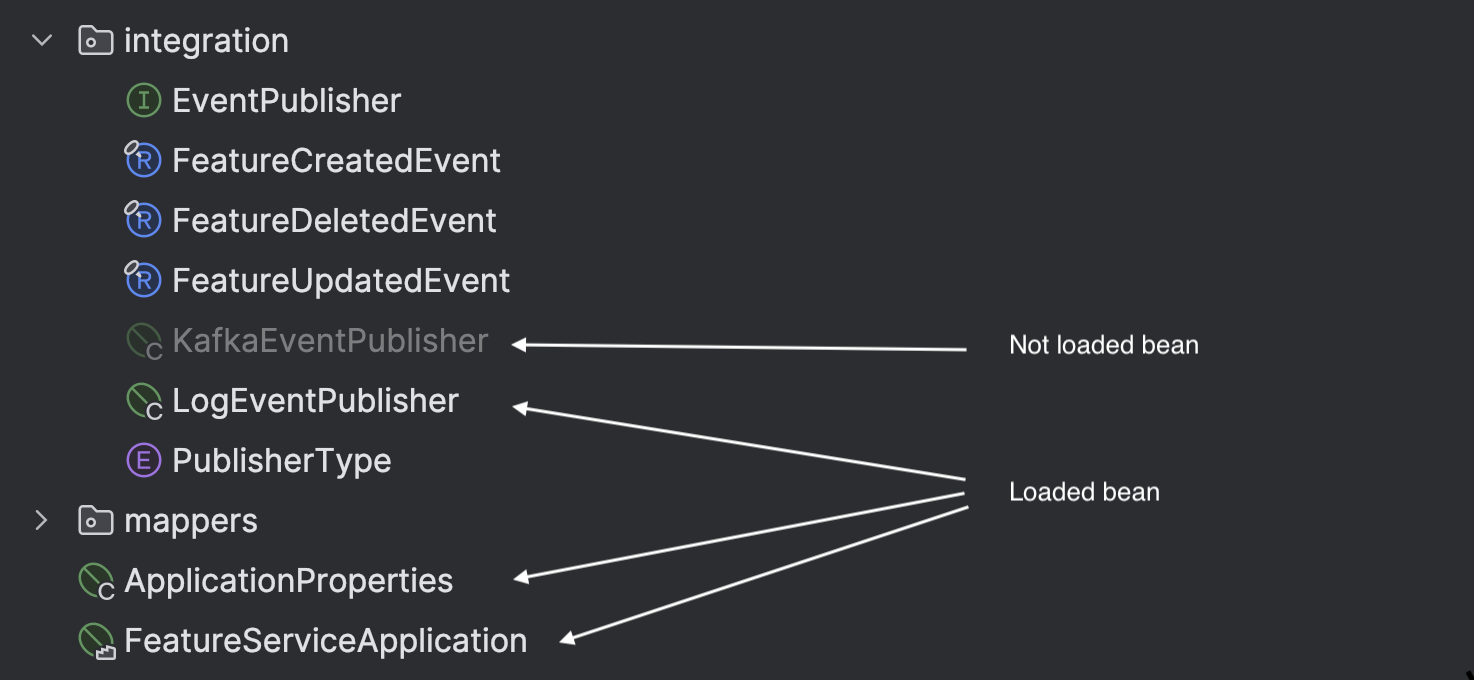
- You can see all Spring-managed beans directly in the Project view.
- Grayed-out entries tell you which ones were scanned but not instantiated.
- Using Mockito in tests? All mocked beans are clearly marked in orange.
And it goes deeper.

While stepping through the code, you can inspect a bean’s metadata, including the scope, profile, context, and even originating factory method. No more guesswork – bean definitions are now first-class citizens in your debugging workflow.
The property maze
You set a property in application.properties, but your app uses a different value. Why?
Spring Boot’s property resolution is layered: file values, profiles, environment variables, system properties, command-line args, post-processors… It’s a maze. Even professional developers need additional tools to get through.
Spring Debugger flattens the hierarchy:
- It shows the effective runtime value inline in
.propertiesand.yamlfiles. - It highlights overridden values and source locations.
- For environment-based or external values, the evaluator reveals the origin clearly.
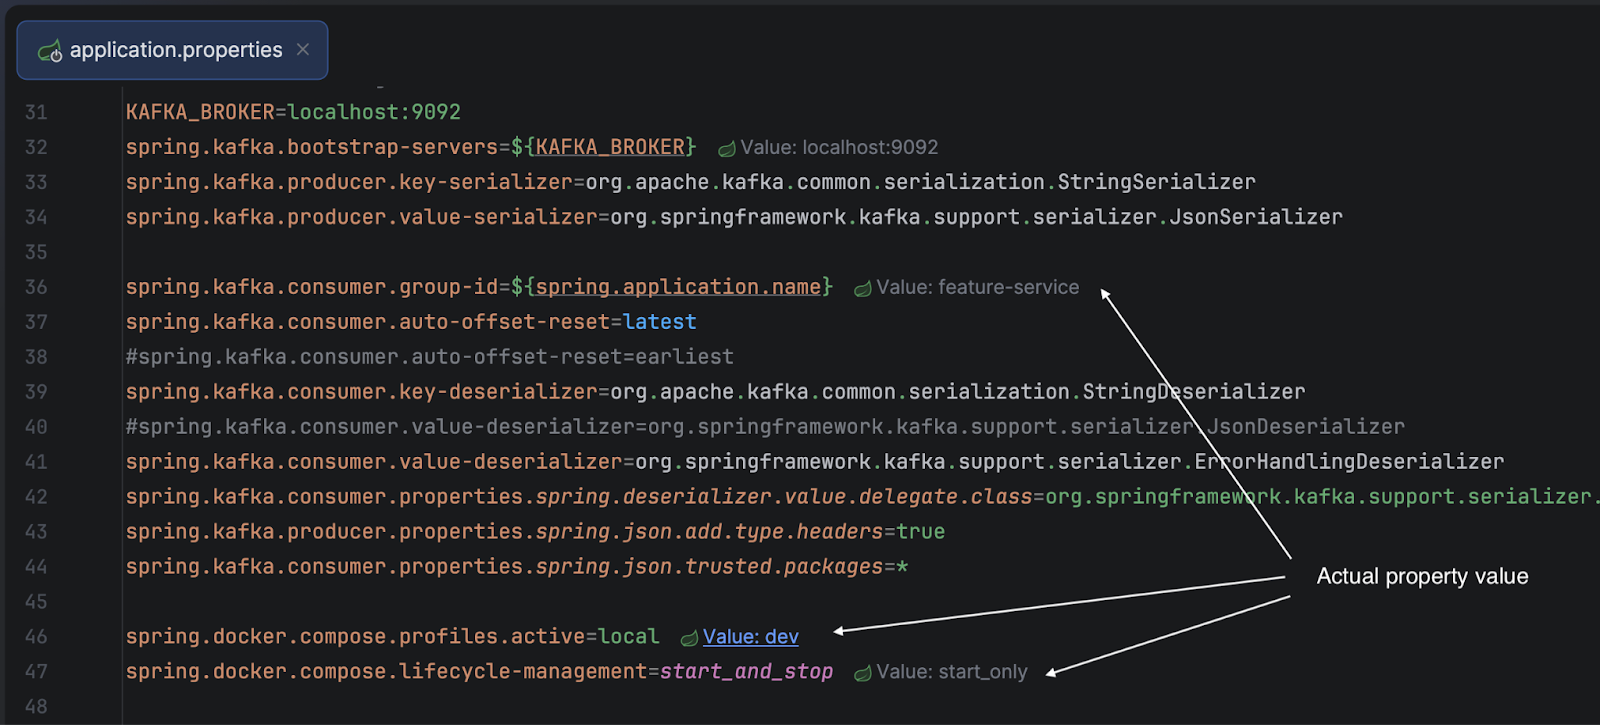
For values from environment variables or external sources, it still shows where they came from in the debugger evaluator. Since you no longer need to trace values back manually, you save time and reduce the number of misconfigurations.
The missing transaction
You annotated your method with @Transactional, but it is not committing. Even worse, you’re getting a LazyInitializationException. What happened?
Spring Debugger helps you understand what’s going on:
- It shows inline indicators for methods executing inside active transactions.
- It displays full transaction details, including isolation, propagation, and the method that started it all.
- A visual hierarchy for nested transactions helps you understand call chains and propagation effects.
- For JPA, it shows the L1 cache state and updates it in real time.
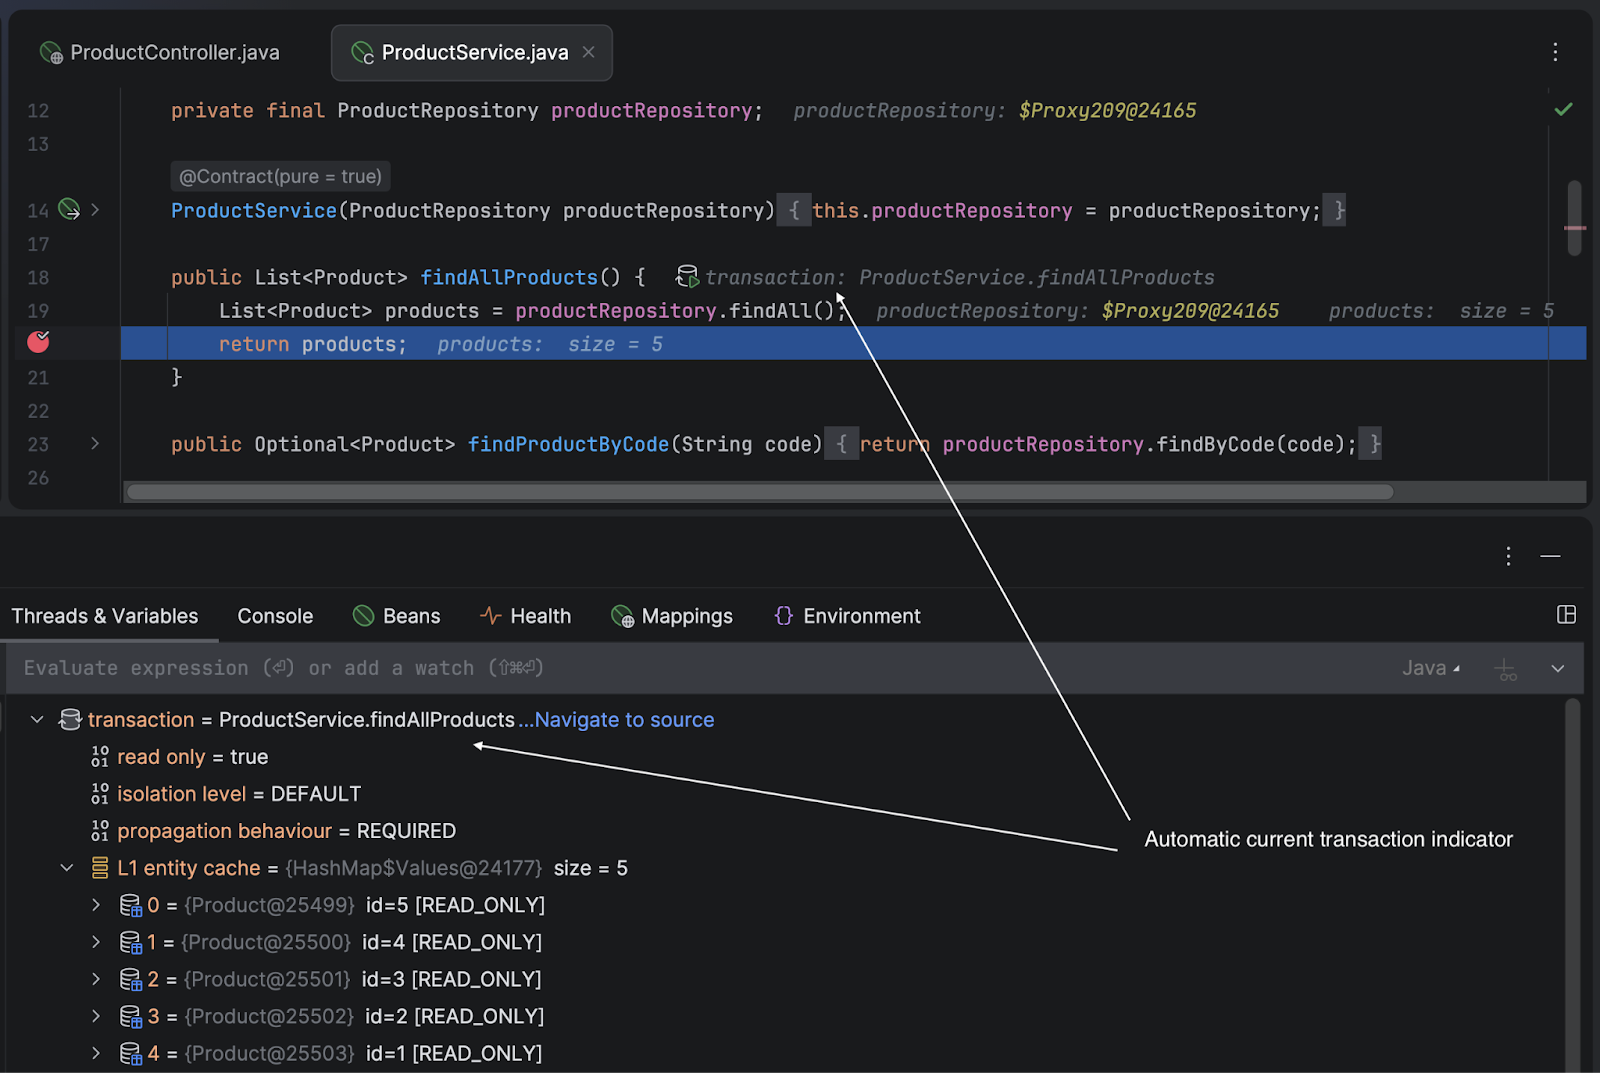
Now you know whether your method is inside the transaction you expected – and where it actually began.
The database client that configured itself
Your app connects to a database – but how? From which config? Which JDBC URL is used? In tests, is it using a Testcontainer? Or is it perhaps an in-memory database like H2?
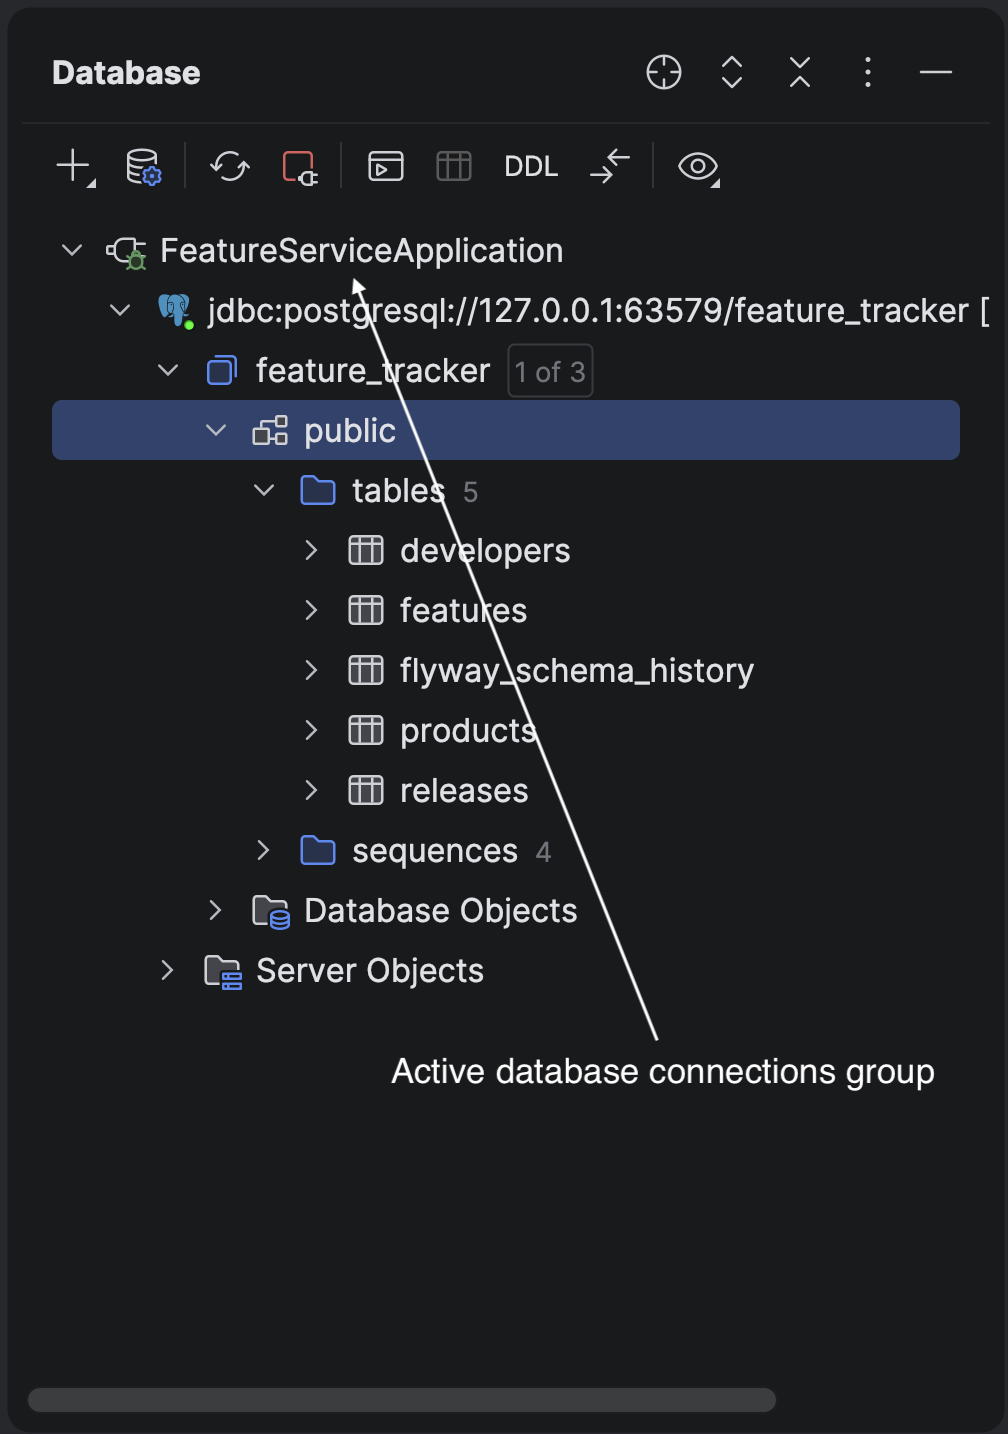
Spring Debugger makes all of this explicit:
- It detects all active
DataSourceconnections automatically. - It groups them under their corresponding run/debug configurations.
- It integrates with IntelliJ IDEA’s Database tool window for inspection.
No need to manually register database connections or dig through logs. You can see every live DataSource and explore it interactively.