


![Apple Reorganizes Executive Team to Rescue Siri [Report]](https://www.iclarified.com/images/news/96777/96777/96777-640.jpg)


![Huawei Pura X doesn’t know whether it’s a flip phone or a book-style foldable [Video]](https://i0.wp.com/9to5google.com/wp-content/uploads/sites/4/2025/03/huawei-pura-x-3.jpg?resize=1200%2C628&quality=82&strip=all&ssl=1)


_Cagkan_Sayin_Alamy.jpg?#)


![[The AI Show Episode 139]: The Government Knows AGI Is Coming, Superintelligence Strategy, OpenAI’s $20,000 Per Month Agents & Top 100 Gen AI Apps](https://www.marketingaiinstitute.com/hubfs/ep%20139%20cover-2.png)

![[The AI Show Episode 138]: Introducing GPT-4.5, Claude 3.7 Sonnet, Alexa+, Deep Research Now in ChatGPT Plus & How AI Is Disrupting Writing](https://www.marketingaiinstitute.com/hubfs/ep%20138%20cover.png)


-Assassin's-Creed-Shadows-Review-00-12-31.png?width=1920&height=1920&fit=bounds&quality=80&format=jpg&auto=webp#)


![Release: Rendering Ranger: R² [Rewind]](https://images-3.gog-statics.com/48a9164e1467b7da3bb4ce148b93c2f92cac99bdaa9f96b00268427e797fc455.jpg)


Digital Twin Technology: Advancing Smart Management in Carbon-Neutral Industrial Parks
Growing climate change concerns in recent years have led to an increased need for carbon dioxide emission reduction. This can be achieved by implementing the concept of circular economy, which promotes the practice of resource conservation, emission minimization, and the maintenance of sustainable revenue streams. Hightopo utilizes the self-developed visualization product — HT for Web to build a lightweight, interactive, and smart energy visualization management system for industrial parks. HT for Web contains not only 2D dashboards but also 3D graphics, to provide a comprehensive solution for energy management and monitoring. Empower industrial park managers and operators to achieve energy saving, centralized monitoring, management & decentralized control of energy. The system includes power distribution, lighting, air conditioning, heating, water supply, and drainage of buildings, etc. Based on the Web, the B/S structure system adopts a modular idea in the development process, that is, each module is developed separately and then integrated to reduce circular dependence and coupling. So as to unify the supervision of each measurement point and optimize the construction management. On the one hand, find out the inefficient operation of the equipment or the corresponding floor area, on the other hand, find out the abnormal energy consumption, reduce the peak power consumption level, and give reasonable suggestions based on data analysis. Responsive design and cross-platform capability let users access the system anytime, anywhere, using any device. Highly interactive and lightweight models ensure an excellent user experience, even when accessed from mobile devices. Main System Overview The Energy Medium module shows users the current medium consumption in two ways. One is divided systematically, the other is divided spatially. Click again to trigger the information about the energy consumption of each subsystem or each device respectively. Enviorment Data Visualization Use wireless sensors to collect environmental data, including indoor and outdoor temperature, humidity, CO2 concentration, VOC concentration, PM2.5 concentration, etc., and classify them according to whether to realize self-renewal in different environments, and propose energy storage optimization solutions for photovoltaics and wind power. Energy Consumption Visualization Data was synced and displayed in the 2D data panel, and data sourced from AC, lighting systems, and other consumer systems was sorted, analyzed, and updated in real time. Water Supply Device Visualization The core system achieves automatic loading and unloading of equipment by communicating with background data. The 2D data panel enables intelligent control and management of all pipelines, equipment, and structures in the water supply and drainage system, get a full grasp of the water system equipment operation status, which includes each floor's wireless water meters, LORA switches, and energy efficiency management platform to ensure the safe and efficient operation of the water supply system. Power Supply Equipment Visualization The highly interactive system ensures a fast response to the power supply. Each piece of equipment can interact and give feedback in real-time. This includes sensors, GPRS/4G/NB-IoT and more. The cross-platform capability of HT allows users to access the system on their mobile phones, tablets, and PC devices. PV Energy Storage Visualization PV Energy Storage is easy to get affected by multiple factors such as weather, temperature, and humidity during actual operation, resulting in intermittent photovoltaic power and random fluctuations in grid power. Digital twins are a good solution to this issue. HT integrated with energy storage equipment data and weather sensor data, TN-S power supply system data to visualize and provide continuous & stable power supply, improve the system work efficiency and power supply reliability. Distribution System The power supply system is generally constructed at the same time as the main building and often comes with problems such as aging equipment, hidden safety hazards, and low intelligence. HT simulates the application scenario of power distribution equipment in buildings. Basement Power Distribution Room Visualization The power distribution room refers to the indoor power distribution place with a low-voltage load, which mainly distributes electric energy for low-voltage users, and is equipped with medium-voltage incoming wires, distribution transformers, and low-voltage power distribution devices. The appearance of the underground power distribution room is highly restored and modeled according to the on-site pictures, CAD drawings, and other data. Based on this, an interactive Web 3D scene can be made and each piece of equipment in the power distribution room can respond to interactive events. When a situation such as a short circuit,
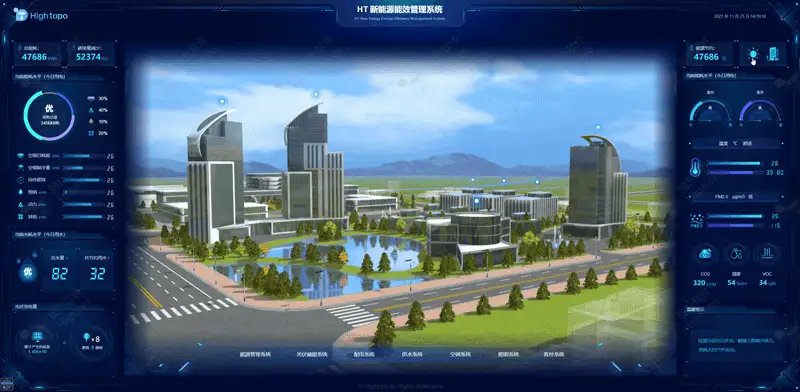
Growing climate change concerns in recent years have led to an increased need for carbon dioxide emission reduction. This can be achieved by implementing the concept of circular economy, which promotes the practice of resource conservation, emission minimization, and the maintenance of sustainable revenue streams.
Hightopo utilizes the self-developed visualization product — HT for Web to build a lightweight, interactive, and smart energy visualization management system for industrial parks. HT for Web contains not only 2D dashboards but also 3D graphics, to provide a comprehensive solution for energy management and monitoring. Empower industrial park managers and operators to achieve energy saving, centralized monitoring, management & decentralized control of energy. The system includes power distribution, lighting, air conditioning, heating, water supply, and drainage of buildings, etc.
Based on the Web, the B/S structure system adopts a modular idea in the development process, that is, each module is developed separately and then integrated to reduce circular dependence and coupling. So as to unify the supervision of each measurement point and optimize the construction management. On the one hand, find out the inefficient operation of the equipment or the corresponding floor area, on the other hand, find out the abnormal energy consumption, reduce the peak power consumption level, and give reasonable suggestions based on data analysis.
Responsive design and cross-platform capability let users access the system anytime, anywhere, using any device. Highly interactive and lightweight models ensure an excellent user experience, even when accessed from mobile devices.
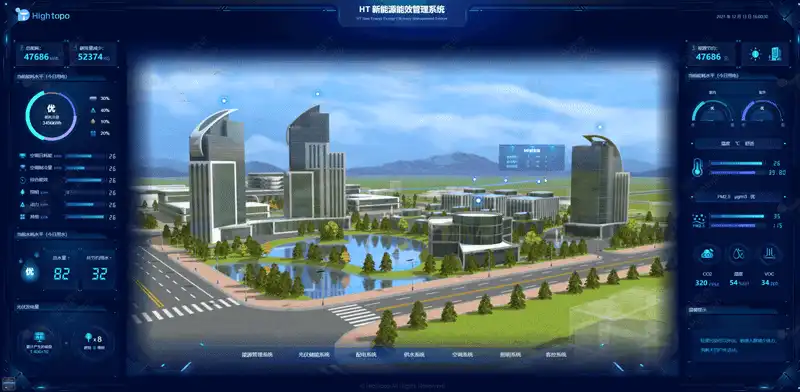
Main System Overview
The Energy Medium module shows users the current medium consumption in two ways. One is divided systematically, the other is divided spatially. Click again to trigger the information about the energy consumption of each subsystem or each device respectively.

Enviorment Data Visualization
Use wireless sensors to collect environmental data, including indoor and outdoor temperature, humidity, CO2 concentration, VOC concentration, PM2.5 concentration, etc., and classify them according to whether to realize self-renewal in different environments, and propose energy storage optimization solutions for photovoltaics and wind power.
Energy Consumption Visualization
Data was synced and displayed in the 2D data panel, and data sourced from AC, lighting systems, and other consumer systems was sorted, analyzed, and updated in real time.
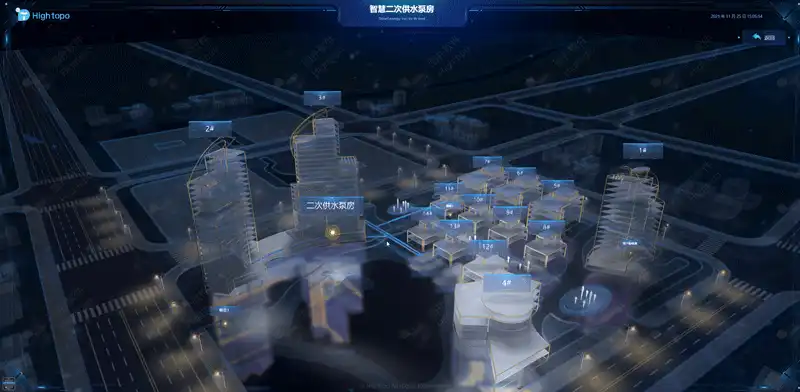
Water Supply Device Visualization
The core system achieves automatic loading and unloading of equipment by communicating with background data. The 2D data panel enables intelligent control and management of all pipelines, equipment, and structures in the water supply and drainage system, get a full grasp of the water system equipment operation status, which includes each floor's wireless water meters, LORA switches, and energy efficiency management platform to ensure the safe and efficient operation of the water supply system.
Power Supply Equipment Visualization
The highly interactive system ensures a fast response to the power supply. Each piece of equipment can interact and give feedback in real-time. This includes sensors, GPRS/4G/NB-IoT and more. The cross-platform capability of HT allows users to access the system on their mobile phones, tablets, and PC devices.
PV Energy Storage Visualization
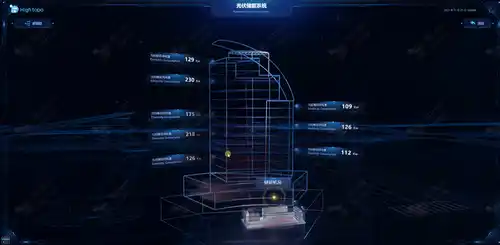
PV Energy Storage is easy to get affected by multiple factors such as weather, temperature, and humidity during actual operation, resulting in intermittent photovoltaic power and random fluctuations in grid power. Digital twins are a good solution to this issue. HT integrated with energy storage equipment data and weather sensor data, TN-S power supply system data to visualize and provide continuous & stable power supply, improve the system work efficiency and power supply reliability.
Distribution System
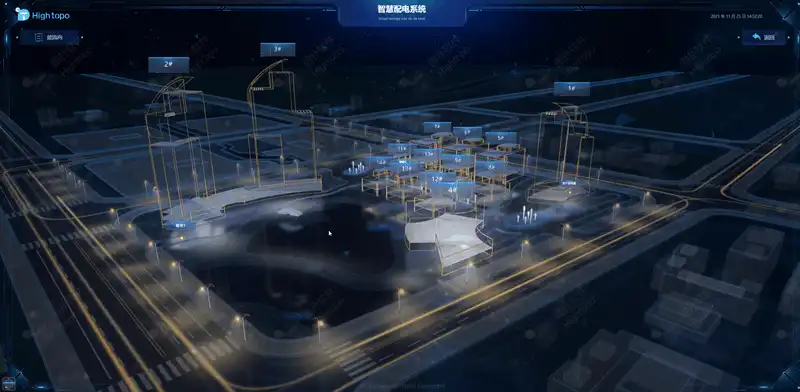
The power supply system is generally constructed at the same time as the main building and often comes with problems such as aging equipment, hidden safety hazards, and low intelligence. HT simulates the application scenario of power distribution equipment in buildings.
Basement Power Distribution Room Visualization
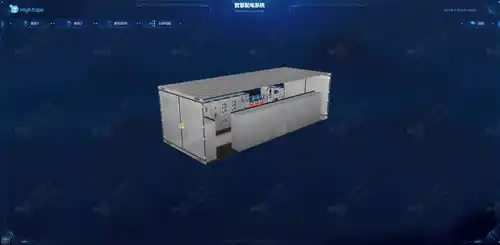
The power distribution room refers to the indoor power distribution place with a low-voltage load, which mainly distributes electric energy for low-voltage users, and is equipped with medium-voltage incoming wires, distribution transformers, and low-voltage power distribution devices. The appearance of the underground power distribution room is highly restored and modeled according to the on-site pictures, CAD drawings, and other data. Based on this, an interactive Web 3D scene can be made and each piece of equipment in the power distribution room can respond to interactive events. When a situation such as a short circuit, or electric leakage occurs, an alarm signal will be issued in time, and supervisors will be notified in real-time, prevent fire and other safety accidents, and ensure the normal operation of system functions and system safety.
Electrical Wiring Diagram
HT for Web not only has a powerful render for 3D graphics, but HT also supports the 2D vector component and the HT special rendering makes 2D and 3D can merge together and reusable.
Water Supply Visualization
Water supply systems use a combination of pipes (of different dimensions and materials), valves, and outlets to deliver water to building users. Some water supply systems also use storage tanks and pumps. Visualizing the water flow/pipeline location in the 3D will greatly help operators to get a comprehensive understanding of the whole water supply system.
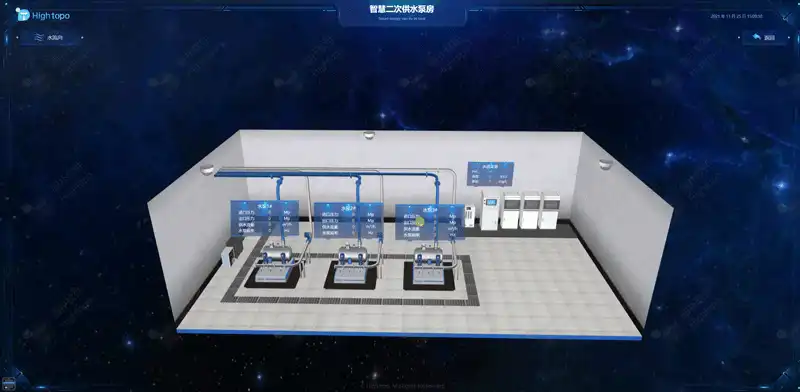
Photo-realistic modeling restores the water pump room. Realize the unified management of water supply flow, pump frequency, inlet and outlet pressure, water turbidity, pH value, residual chlorine, etc., to meet the user’s needs for water quality, water volume, and water pressure, and to solve the actual operation problem of the water supply system due to changes in water demand, accidents such as pump stoppage, etc., to ensure the normal operation of enterprises.
HVAC System
Chilled Water Storage
A chilled water system uses a conventional electric chiller to prepare cold water during the valley power period at night, and then store the cold water in a water tank (tank). The water storage technology can cut peaks fill valleys and balance the load of the power grid. The water absorbs heat from the building and disperses it outside. The system cools the water down to a temperature of 4 degrees and then circulates it through the water coil’s air handler.
Water Level Visualization
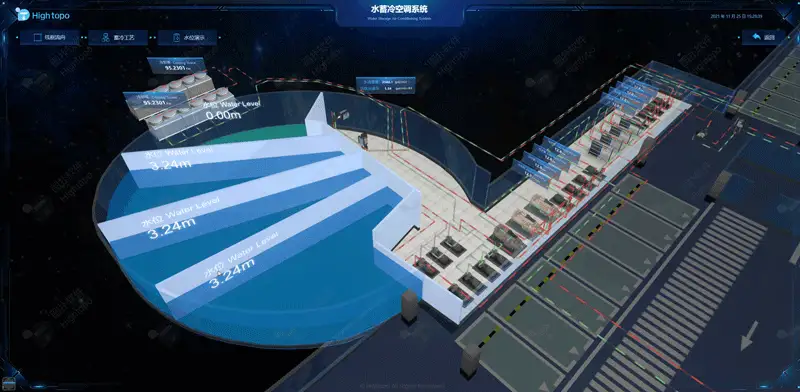
Using cloud computing, Internet, GIS, and other technologies to remotely monitor parameters such as water level, water flow speed, load flow rate, cooling tower energy consumption, etc., to obtain the complete change of water level, and convert them into electrical signals to transmit to the computer. Reduce the installed capacity of various equipment, improve the efficiency of the host, make full use of the advantages of the cold storage device, and reduce the energy consumption of the system.
Lightning System Visualization
HT supports OBJ format 3d modeling files and MTL files and displays them on the web. Combined with the weather system, we can analyze and control the indoor light intensity and operation duration. Therefore, control the energy consumption. Also, the system will highlight the out-of-function device, easy for operators to locate and maintain.
Guest Room Control System
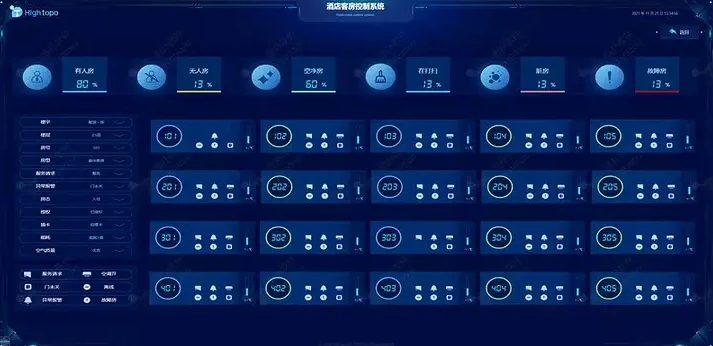
HT as a visualization tool, adapted to B/S structure, makes it easy to integrate with other systems. Also, the B/S structure offers the ability of remote access to the system anywhere and anytime. Without downloading an app, all the data is live in real time. Operators can access the system on a phone, PC, or tablet with any modern browser, reducing the uncertainty of management and daily operation and increasing efficiency.
Conclusion
Building Energy Management Systems (BEMS) provide real-time remote monitoring and integrated control of a wide range of connected systems, allowing modes of operation, energy use, environmental conditions and so on to be monitored and allowing hours of operation, set points, and so on to be adjusted to optimize performance and comfort. BEMS can also trigger alarms, predict problems, and inform maintenance programs.
Hightopo brings the web graphic library — HT for Web to empower BEMS, and use digitization and visualization as two key pillars to help achieve the energy efficiency goals and towards the goal of Carbon Neutral.
Hightopo Portfolio: https://www.hightopo.com/demos/en-index.html
Hightopo LinkedIn: https://www.linkedin.com/company/hightopo
Hightopo Medium Blog: https://hightopo.medium.com/
Hightopo Facebook: https://www.facebook.com/hightopo2d3d/
Hightopo Twitter: https://twitter.com/hightopo2d3d
Hightopo Instagram: https://www.instagram.com/hightopo/