


![iOS 19 Leak: First Look at Alleged VisionOS Inspired Redesign [Video]](https://www.iclarified.com/images/news/96824/96824/96824-640.jpg)

![OpenAI Announces 4o Image Generation [Video]](https://www.iclarified.com/images/news/96821/96821/96821-640.jpg)


![Do you care about Find My Device privacy settings? [Poll]](https://i0.wp.com/9to5google.com/wp-content/uploads/sites/4/2024/06/Chipolo-One-Point-with-Find-My-Device-app.jpg?resize=1200%2C628&quality=82&strip=all&ssl=1)


![[The AI Show Episode 140]: New AGI Warnings, OpenAI Suggests Government Policy, Sam Altman Teases Creative Writing Model, Claude Web Search & Apple’s AI Woes](https://www.marketingaiinstitute.com/hubfs/ep%20140%20cover.png)
![[The AI Show Episode 139]: The Government Knows AGI Is Coming, Superintelligence Strategy, OpenAI’s $20,000 Per Month Agents & Top 100 Gen AI Apps](https://www.marketingaiinstitute.com/hubfs/ep%20139%20cover-2.png)


.png?width=1920&height=1920&fit=bounds&quality=80&format=jpg&auto=webp#)


A Beginner's Guide to Observability in Cloud Native Applications
If you're new to cloud native technologies, you may have heard the term 'observability' before. But what exactly does it mean? Is it simply the ability to observe? And if so, what are we observing and why? I had the same questions when I started lear...
If you're new to cloud native technologies, you may have heard the term 'observability' before. But what exactly does it mean? Is it simply the ability to observe? And if so, what are we observing and why?
I had the same questions when I started learning about cloud-native technologies. In this article, I'll share my understanding of core observability concepts, introduce essential observability tools, and share insights from a related project I’m working on.
Table of Contents
My Introduction to Cloud Native Technologies
I recently got selected as a mentee for the Linux Foundation Mentorship to work on the CNCF - Prometheus project. The project is UX-focused, and for the next few months, I'll be working with my mentors to understand how users expect to use OpenTelemetry Line Protocol (OTLP) Resource Attributes in Prometheus.
That's quite a mouthful, I know. I was overwhelmed at first, and honestly, I’m still figuring it out. This is my third week, and although I still have a lot to learn—given that I had no knowledge of cloud native technologies when I applied for this internship—I've already learned quite a bit.
As I often do, I intend to document what I learn through articles to help reinforce concepts in my memory and serve as a resource for other newcomers who may find themselves grappling with these technical terms in the future. You know what they say: you can't say you've understood something until you're able to explain it to someone else who's also new to the topic.
What is Observability?
First, I had to learn what the unfamiliar terms meant—and there were a lot of them flying around. OpenTelemetry. Prometheus. Resource attributes. I’ve come to understand that these terms fall under one umbrella: Observability. Let's start there.
Let’s use a food delivery app to illustrate. When someone orders food, a lot happens behind the scenes:
The app connects to different services (restaurants, payments, delivery)
Data flows between different systems to process the order, assign a driver, and track delivery
Engineers need to monitor all the processes to ensure everything works smoothly. Are orders taking too long to process? Is the payment system failing? Does the app suddenly crash under load? Which part of the system is causing delays?
To answer these questions, engineers instrument their code. This means that they configure it to send back real-time data about the state, performance, and behavior of the application. This practice of understanding what's happening inside a complex system based on the data it generates is known as Observability.
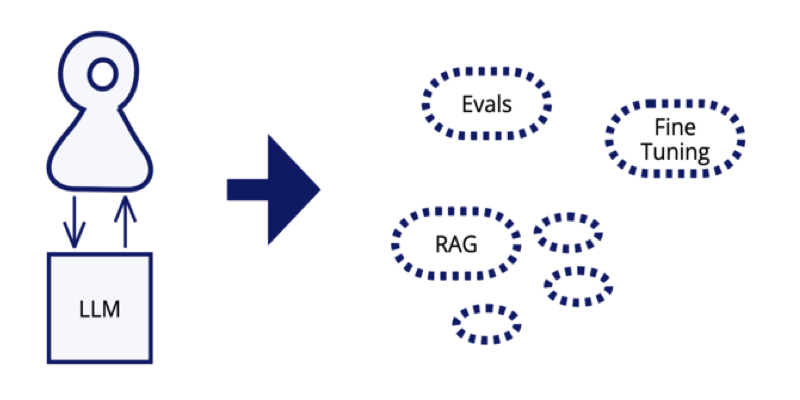
You can see the process illustrated in the image below:
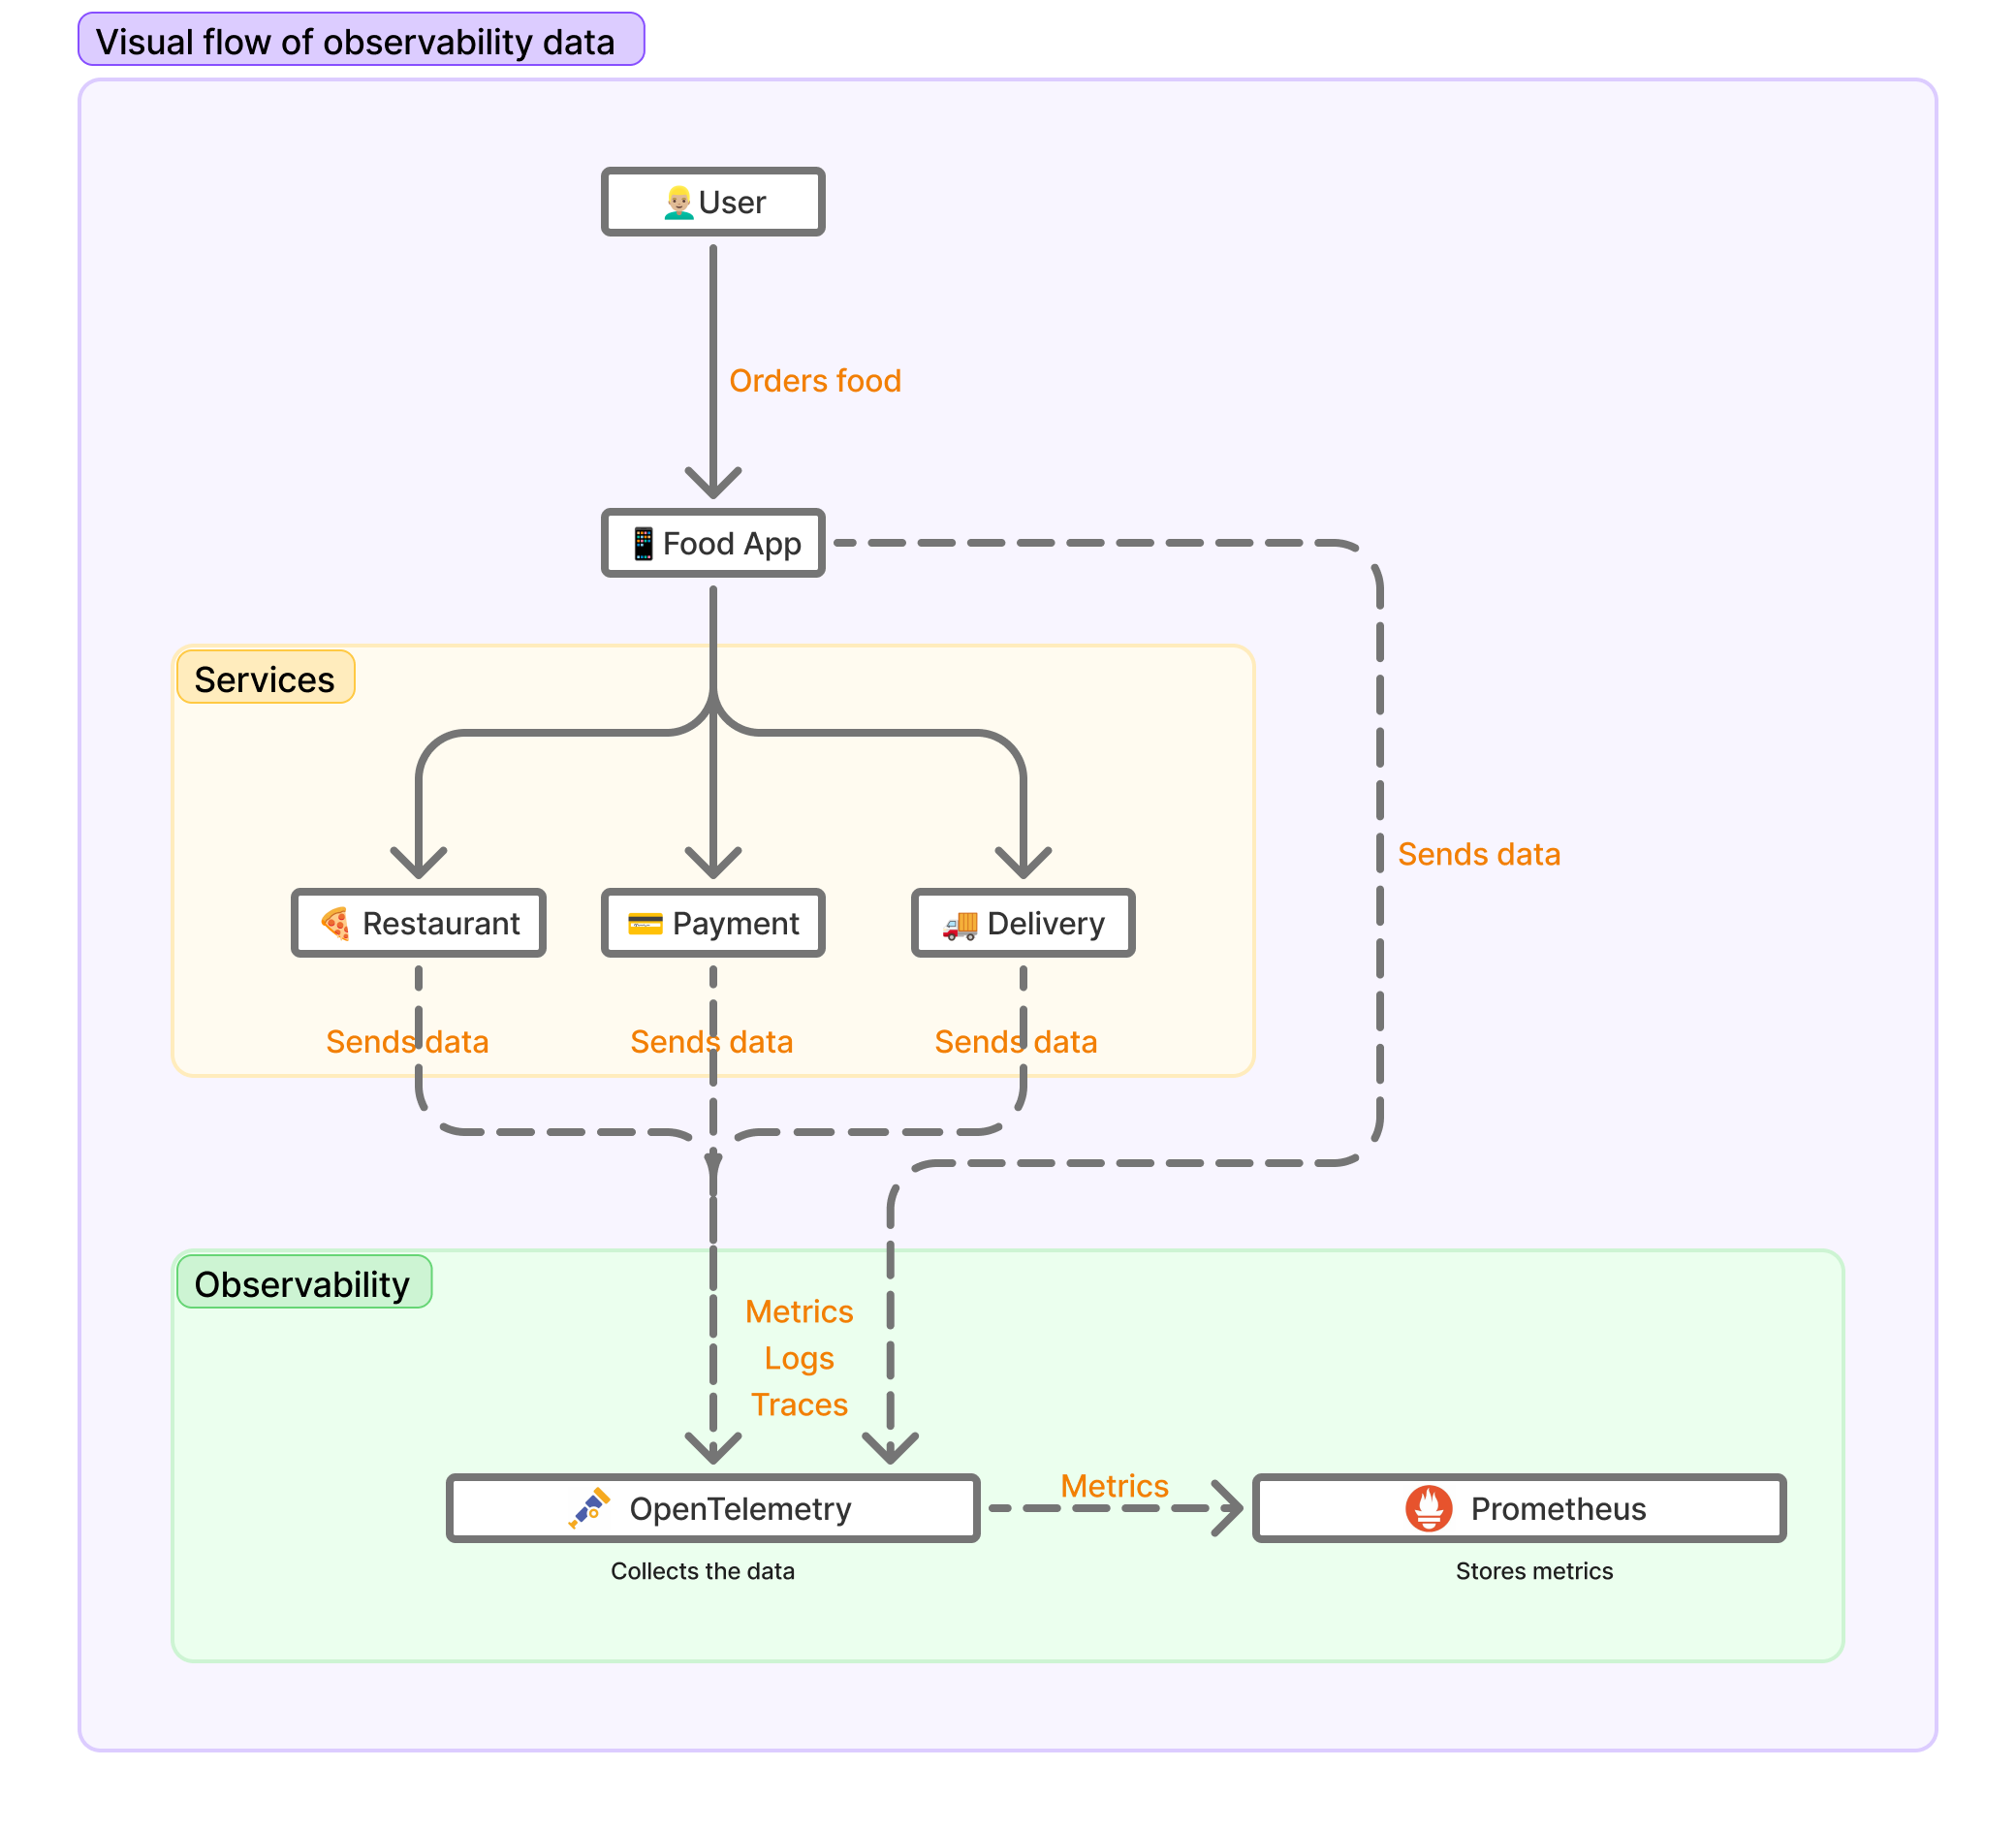
In the above flowchart diagram, you can see how data might move through a food delivery application system. The flow starts with a User who orders food from a Food App. The Food App connects to three services (Restaurant, Payment, and Delivery). All these components send data to OpenTelemetry, which collects three types of data: Metrics, Logs, and Traces. OpenTelemetry then forwards only the Metrics data to Prometheus, which stores metrics.
Types of Observability Data
There are three key types of data that systems generate for observability:
1. Metrics
Metrics are numerical measurements collected over time that represent the state or performance of your system. Examples in a food delivery app would be the number of orders processed per minute, average order processing time in milliseconds, number of active users or delivery drivers, and so on.
2. Logs
Logs are text-based records of discrete events that occur within your application. Logs for our food delivery app would look something like this:
ERROR: Payment failed for order #12345 - Credit card declined
INFO: Driver #789 assigned to order #12345
3. Traces
Traces track the entire lifecycle of a request as it moves through different services in a system. They help engineers see how different components interact and identify bottlenecks in complex, distributed systems.
For example, in our food delivery app, a single order request might go through the following steps:User places an order → Request sent to restaurant system → Payment processor verifies payment → Delivery system assigns a driver → User receives confirmation.
Each step in this journey is recorded as part of a trace. This helps engineers pinpoint where delays occur and optimize the system for better performance.
Observability relies on metrics, logs, and traces working together to provide full system visibility. Metrics tell you something is wrong (“Error rate increased by 5%”). Logs tell you why it happened (“Payment failed due to invalid card details”). Traces show exactly where it happened (“Delay in restaurant service response”).
Observability Tools
Observability tools give you visibility into what’s going on within your application. There are a lot of them, but for the purpose of this article, we’ll talk about two: Prometheus and OpenTelemetry.
Prometheus
Prometheus is an open-source monitoring and alerting toolkit. It does two things:
Collects data from applications, specifically metrics (remember the data types we talked about earlier)
and stores them in a time-series database.
A time-series database is a database specifically designed to handle measurements or events that occur over time.
Prometheus uses what's called a pull-based model to collect metrics from applications. Pull-based means Prometheus actively requests (pulls) data from services at regular intervals. Think of it like refreshing a webpage to get the latest content.
OpenTelemetry
OpenTelemetry (OTel) collects, processes, and exports observability data. Unlike Prometheus, which mainly focuses on metrics, OpenTelemetry provides a standardized way to instrument applications for all three types of observability data: logs, metrics, and traces.
OpenTelemetry is designed to be vendor-agnostic. This means you can instrument your applications once with OpenTelemetry and then send that telemetry data to any supported observability backend, which could be an open-source solution like Jaeger or Prometheus, or commercial platforms like Datadog, New Relic, Dynatrace, or Honeycomb.
So, for example, you can use OpenTelemetry to instrument your application – and then Prometheus can pull metrics from OpenTelemetry while other tools handle logs and traces.
What are OTLP Resource Attributes?
When OpenTelemetry collects data from applications, it does more than just gather raw telemetry data. It also provides context about that data. This context comes in the form of resource attributes, which describe where the data came from and what it relates to.
The 'resource' is the component (or entity) producing the data, while the 'attributes' are specific details about that resource.
Resource attributes are structured as pairs of information:
The "key" is the name or identifier of the attribute (like
service.nameorhost.id)The "value" is the specific information for that attribute (like
payment-serviceorserver-123)
Together, these key-value pairs identify and describe the specific component that's generating the observability data.
For example, if a payment processing service is sending metrics about transaction times, the resource attributes might include:
service.name: "payment-service"service.version: "1.2.3"deployment.environment: "production"
These attributes tell you exactly which service, which version, and in which environment the data is coming from, providing context for interpreting the metrics, logs, or traces.
Resource attributes are not arbitrary. OpenTelemetry provides a standardized set of attribute names and formats that everyone should follow, similar to having an agreed-upon language for describing services and their properties.
For example, OpenTelemetry specifies that you should use service.name (not app_name or service_id) to identify your service. They've created these standardized naming conventions (called semantic conventions) so that:
All tools in the ecosystem can understand the same attributes
Engineers across different companies use consistent terminology
Observability data can be easily shared between different systems
You can still create your own custom attributes when you need something specific (like payment.provider for a payment service), but using the standard attributes whenever possible means your telemetry data will work better with existing tools and be more easily understood by other engineers.
Importance of OTLP Resource Attributes
Let’s say engineers want to monitor how long food deliveries take and whether there are delays in specific locations. Without resource attributes, OpenTelemetry might simply collect and report this metric like this:
delivery_time_seconds: 1800
This tells us that a delivery took 1,800 seconds, or 30 minutes, but nothing else. That’s useful, but it lacks context. Where did this happen? Which service handled it? If there was a delay in delivery and engineers wanted to investigate the cause, this alone would not help.
With OpenTelemetry’s resource attributes, the metric becomes more meaningful:
delivery_time_seconds: 1800
resource:
  service.name: "delivery-service"
  service.instance.id: "instance-456"
  cloud.region: "ng-west-2"
  deployment.environment: "production"
  customer.city: "Lagos"
  restaurant.id: "rest-789"
This tells us:
The data came from the delivery service.
The instance handling the request is "instance-456".
It’s running in the ng-west-2 cloud region.
The environment is Production (not testing or staging), and so on.
Now, engineers can answer more specific questions:
Are deliveries slower in certain cities? (Filter by
customer.city)Are certain restaurants taking longer to prepare food? (Filter by
restaurant.id)Are delays only happening in a specific cloud region? (Filter by
cloud.region)Are issues only happening in production or also in staging? (Filter by
deployment.environment)
When issues arise, resource attributes allow engineers to quickly narrow down the source of problems. Rather than investigating every service, they can filter by specific attributes to focus their efforts.
How My Project Work Fits into All This
Many engineers use OpenTelemetry for data collection and then send metrics to Prometheus for storage, querying, and analysis.
But Prometheus does not natively support resource attributes in the same way as OpenTelemetry. Instead, it relies on labels to organize metrics. Since Prometheus traditionally has its own labeling system for metrics, integrating OpenTelemetry's resource attributes creates interesting UX challenges.
One key challenge is the cardinality explosion. Cardinality refers to the number of unique combinations of label values (or dimensions) that a metric can have. A "cardinality explosion" occurs when you add labels with many possible values. OpenTelemetry often includes many detailed attributes that, if directly converted to Prometheus labels, would create an overwhelming number of time series. This can slow down Prometheus dramatically or even cause it to crash.
The existing solution involves stuffing all resource attributes into a single JSON-encoded Prometheus label. While this prevents the cardinality explosion, it makes querying extremely cumbersome. Users have to use complex join operations and specialized query syntax to filter or aggregate based on these attributes.
This approach is technically functional but creates a poor user experience. My research aims to understand how users mentally model the transition from OpenTelemetry's rich attribute system to Prometheus's more constrained label system.
The research goals are to:
Understand how engineers currently use OpenTelemetry resource attributes with Prometheus
Identify pain points in the current integration between these systems
Discover user expectations for how resource attributes should be represented in Prometheus
This work is particularly important as more organizations adopt OpenTelemetry as their instrumentation standard while continuing to use Prometheus for metrics monitoring. Creating a seamless experience between these two popular open-source projects will help improve the overall observability ecosystem.
Conclusion
Observability in cloud native applications is clearly an interesting subject and important for building reliable, performant systems. The tools and concepts we've explored – metrics, logs, traces, Prometheus, and OpenTelemetry – form the foundation of modern observability practices.
As I continue my mentorship program, I'll share more insights about how these technologies work together and try to break them down from the perspective of a first-time learner.
Additional Resources
Learn more about: