


![iOS 19 Leak: First Look at Alleged VisionOS Inspired Redesign [Video]](https://www.iclarified.com/images/news/96824/96824/96824-640.jpg)

![OpenAI Announces 4o Image Generation [Video]](https://www.iclarified.com/images/news/96821/96821/96821-640.jpg)


![Do you care about Find My Device privacy settings? [Poll]](https://i0.wp.com/9to5google.com/wp-content/uploads/sites/4/2024/06/Chipolo-One-Point-with-Find-My-Device-app.jpg?resize=1200%2C628&quality=82&strip=all&ssl=1)


![[The AI Show Episode 140]: New AGI Warnings, OpenAI Suggests Government Policy, Sam Altman Teases Creative Writing Model, Claude Web Search & Apple’s AI Woes](https://www.marketingaiinstitute.com/hubfs/ep%20140%20cover.png)
![[The AI Show Episode 139]: The Government Knows AGI Is Coming, Superintelligence Strategy, OpenAI’s $20,000 Per Month Agents & Top 100 Gen AI Apps](https://www.marketingaiinstitute.com/hubfs/ep%20139%20cover-2.png)


.png?width=1920&height=1920&fit=bounds&quality=80&format=jpg&auto=webp#)


Data-Driven March Madness Predictions
How to optimize your bracket systematically, no college basketball knowledge required The post Data-Driven March Madness Predictions appeared first on Towards Data Science.

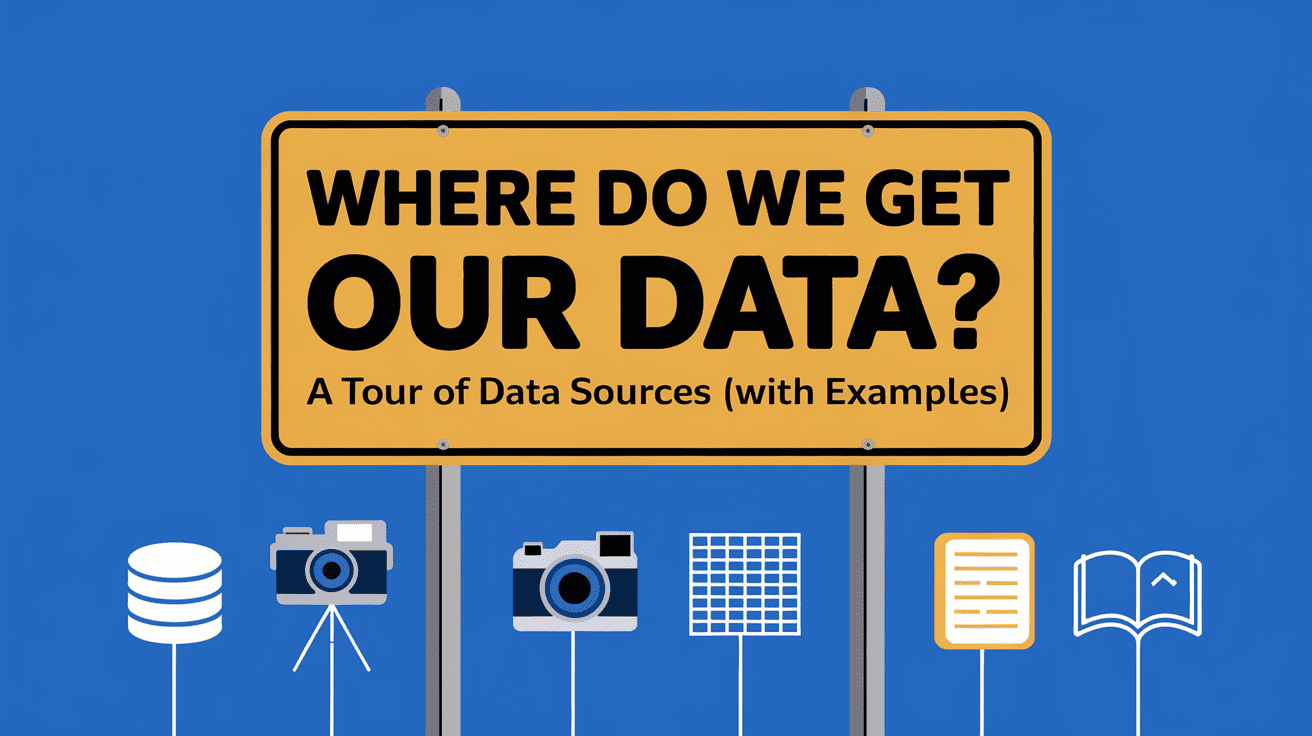
Finding the right data
Different sources offer different ways of measuring team strength, each with its methods. Some of the more commonly used sources are; KenPom Ratings, Nate Silver’s FiveThirtyEight’s Predictions, the NCAA Standings and Team Stats, or even Vegas Odds and Betting Markets. The latter is an intersting predicting of the game since it factors in a lot of different sentiment either from just the public or experts.
Each of these sources has strengths and weaknesses, some are heavier on the statistical methods and even combine various data sources, e.g. Nate Silver, while others use the raw season information and historical trends. Understanding these differences between the sources is key when deciding which numbers to trust in your bracket predictions.
Before diving into the key metrics, it’s important to acknowledge a fundamental limitation: in an ideal world, a fully optimized model would incorporate individual game statistics from the past season, player performance data, and historical trends. Unfortunately, I don’t have access to that level of granular data, and seconly since this is just a fun project I dont want to make things overly complicated. Instead, I had to rely on my own brain an use proxies based on the KenPom rankings data. The big question remains: How well will this model perform? I make no claims that it will be perfect. In fact, the only certainty in March Madness is that it will be wrong. But at the very least, this model provides a structured, data-driven way to make better decisions, even with my limited knowledge of college basketball teams.
The key metrics to unlock a winning bracket
When building a predictive model for March Madness, the challenge is deciding which statistics truly matter. Not every statistic is important, some provide deeper insight into team performance, while others are just cuase confusion. To balance predictive power with simplicity, I selected a handful of key metrics that capture overall team strength, consistency, and potential for upsets. These include efficiency ratings, luck, momentum, tempo, and volatility, each playing a crucial role in simulating realistic tournament outcomes.
Team efficiency (net ratings & adjusted ratings)
Net Rating: This is the difference between a team’s Offensive Rating and it’s Defensive Rating. This metric gives me a measure of overall team strength Kenpom calculates this by computing by how many points a team outscores its opponents per 100 possessions.
Adjusted Efficiency: Sine some leagues or more competitive than others I felt that relying only on Net Rating would unfairly treat teams in though competitions. So I use the conference average competitativeness as an adjustment that ensures that teams playing in weaker conferences and doing really well are penalized while teams facing though competitors get a bonus.
The faster you go, the harder you fall
My logic here was that teams that play at a faster pace create more possessions per game. This has the disadvantage that not only increases it the number of opportunities for scoring but also for mistakes. This higher tempo can, therefore, lead to greater variance in performance. And a high variance in performance makes the team more prone to high-risk, high-reward scenarios, resulting in either blowout wins or shocking upsets. This allows team that are on paper disfavored to close the gap in quality difference and give their opponents a harder time. Teams that rely on high-tempo play styles are.
Luck factor
Not all wins and losses tell the full story. Some teams are known to win more games than they should compared to the predictions that data might give. While others can underperform, an example is that they lose close games that should have turned their way. However, Luck might be the hardest of the metrics to really trust, like I don’t even trust my own luck…
So, how do I fold in the Luck Factor? Based on Kenpoms data, Luck measures the difference between a team’s actual win-loss record and its expected record. A team with a high luck rating won more games than expected. While a team with negative luck may have been on the wrong end of buzzer-beaters, while they overall play good games.
Momentum: High peaks and low lows
In an ideal world, I would measure momentum by looking at a team’s last 10–20 games, identifying the teams that feel invincible leading into the tournament. But without direct access to that data, I had to get creative and find a proxy.
I define momentum as how much a team is overperforming relative to the league average. I compare a team’s Net Rating to the overall league mean, teams that are well above average are considered to have more momentum, while teams that fall below average get reduced.
Fatigue: A tournament is a marathon not a sprint
Not all wins have the same effect on a team’s energy levels. A nail-biting overtime victory against a strong opponent could have serious consequences compared to an easy double-digit win. To account for this, I rescale the team’s rating with a fatigue factor. This factor is computed by penalizing teams that are predicted to win with a slim probability margin.
In summary, these six factors are the main ingredients into computing the probability if a team wins or loses. But knowing the metrics is only half the story. Now, I need a code that can fully simulate the tournament, and I hope that I get more realistic outcomes than just relying on the cutest-looking mascot (I do like the dogs!) or seed-based assumptions.
The algorithm: Simulating the madness
In short, my March Madness model is built around so called Monte Carlo simulations, these are probabilistic simulations that turn my basketball metrics into tens of thousands of tournament outcomes to find out which team advances to the next rounds. So I am not computing a single bracket, my codes runs tens of thousands of simulations, each time playing out the tournament from start to finish under different conditions.

Step 1: Generating matchups
The first-round matchups are built using the tournament seeds from NCAA, where I had to make sure that the bracket I simulate follows result in proper team pairings. For this I use the seeding rules, pairing teams like 1-seed vs. 16-seed, 8-seed vs. 9-seed, and so on, just like in the real tournament.
Step 2: Computing win probabilities
Each game is simulated using a logistic probability function. This means every game has some form of complex level of uncertainty, instead of simply favoring the higher seed every time. The probability then depends on the key metric I described above: Adjusted Team Strength, Volatility, Style of Play, Fatigue Effects and Luck. Lastly I added a Upset generator, for this I randomly drawn a number from a heavy side t-distribution, these distribution are great to mimic rare events and adds a bit more noise to the predictions. Each factor has its own weight factor that the I can pick to make certain effects more or less important and a total combined probability is calculated.
Step 3: Running the tournament
The simulator then runs in two modes, the first mode can determine the most probable bracket; the model simulates each game in a round tens of thousands of times. After each round, it computes how often a team wins or loses, and computes a certainty; the ratio between the number of wins to the number of games played, this will be important for finding potential upsets. The winners move on, and new matchups are formed and the cycle is repeated for the next rounds.
The second mode computes champion predictions, this means that instead of running each game tens of thousands of times, I run full brackets tens of thousands of times and afterwards I count how often each team wins it all.
Step 4: Analyzing outcomes
After the tens of thousands of simulated tournaments, the model sums up the results and leaves it me to analyze the results:
• Championship Odds (How often each team wins it all)
• Final Four Probabilities (Who makes it deep into the bracket)
• Biggest Upset Chances (Which lower seeds pull off shocking wins)
Rather than simply guessing winners, the model quantifies which teams are most likely to either advance or win the championship, I get a percentage by counting their succeses compared to the total simulations the code ran.
The base prediction
So onto the fun part, how do I pick for March Madness?
Crowning a champion
For my top four champions I found; Duke, Florida, Auburn and Houston. Compared to betting offices this looks fairly reasonable! Not surprisingly these four teams also have the highest odds of making the Final Four and are the highest seeds going into the tournament. If you don’t have one of these four as your winner… You might be in trouble!
Deciding the bracket
Once I have the full bracket and the potential champions the work is only just getting started. Who will be the big upsets this year? And this is where things get interesting, as anyone who ever participated in these bracket challenges knows. On one hand you want to bank on games that have a very clear winner, and identify a handful of close games that might go either way and roll the die. After all, March Madness isn’t about getting every pick right, it’s about picking the right surprises.
Pick your upsets
So, the toughest question remains, how do you spot this year’s Cinderella story? Every tournament, a lower-seeded team shocks the field, busting brackets everywhere. But can I predict which teams are most likely to pull off an upset?
To find potential upsets, I focused on two sets of teams:
1. Teams that are predicted to beat their higher-ranked opponent
Some teams in my model are projected to win their game while their opponent has a higher seed. These are slam-dunk picks for an upset! To give some examples that came out of my final simulation;
Memphis [5] vs Colorado St. [12] -> Colorado St. [12]
Mississippi St. [8] vs Baylor [9] -> Baylor [9]
2. Is the game projected to be close?
This is more tricky and will come down to luck. Any game where the model gives the underdog at least a 40% chance I identify as a potential upset. A specific good example of this is Connecticut [8] vs Oklahoma [9] -> Connecticut [8] which truly is a coin toss in my simulation. Which of these potential upsets to pick as actual upsets… That’s down to a coin flip.
At the end of the day, March Madness thrives on chaos. You can use data, probability, and past performance to make smarter picks, but sometimes the biggest upsets come down to nothing but luck. Choose wisely…
Wrapping up: What I learned
This project was a deep dive into finding order in the chaos of March Madness, combining my knowledge of data science with the unpredictability of college basketball. I had a lot of fun building my, and if there’s one thing I’ve learned, it’s that you don’t need code to compute the probability of being wrong. Being wrong is a 100% given. The real question is: are you less wrong than everyone else? There are so many uncertainties that I haven’t accounted for or are impossible to avoid. Upsets will happen, Cinderella stories will unfold, and no model, can fully predict the Madness.
If you want to have a look at my code: https://github.com/jordydavelaar/MarchMadSim
A Word of Caution: The code I developed was just a fun weekend project, and this write-up is meant to be educational, not financial advice. Sports betting is very risky, and while data can provide insights, it can’t predict the future. Bet responsibly and seek help if you need it. Call 1–800-GAMBLER.
Acknowledgment: While writing my code, I made use of the LLM ChatGPT, the data used to make predictions was paid for and came from Kenpom.
The post Data-Driven March Madness Predictions appeared first on Towards Data Science.