How to Use Wireshark Filters to Analyze Your Network Traffic
Wireshark is an open-source tool widely regarded as the gold standard for network packet analysis. It allows you to capture live network traffic or inspect pre-recorded capture files, breaking down the data into individual packets for detailed examin...

Wireshark is an open-source tool widely regarded as the gold standard for network packet analysis. It allows you to capture live network traffic or inspect pre-recorded capture files, breaking down the data into individual packets for detailed examination.
You can use Wireshark in scenarios like troubleshooting network performance issues (for example, slow connections or dropped packets), investigating suspicious activity (like detecting malware or unauthorized access), or learning how protocols like HTTP, TCP, or DNS function in real-world environments.
For beginners, think of it as a window into the invisible world of network communication, revealing what’s happening behind the scenes when you browse the web, send an email, or stream a video. Its power lies in its ability to provide granular insights, making it an indispensable tool for network administrators, cybersecurity enthusiasts, and anyone curious about how networks operate.
In this tutorial, you will learn how to use Wireshark display filters to analyze network traffic and spot potential security threats. Wireshark is a powerful network protocol analyzer that can capture and dissect network packets, which is crucial for cybersecurity professionals.
Here’s what we’ll cover:
Prerequisites
Before we start, you'll need to know Linux Basic Syntax. You can learn it through this Linux Skill Tree.
Don't worry if you're new to Wireshark – I’ll explain everything as we go.
How to Start Wireshark and Analyze Network Traffic
In this step, we're going to start using Wireshark. First, you'll learn how to launch it. Then, you'll either capture network traffic or use a provided sample file for analysis. Understanding the Wireshark interface is crucial, as it helps you view and analyze packet data.
Installing Wireshark on Ubuntu 22.04
Before you can start using Wireshark, you need to install it. Open a terminal window and run the following commands:
sudo apt update
sudo apt install wireshark -y
Launching Wireshark
To start Wireshark, you need to open a terminal window. You can do this by clicking on the terminal icon in the taskbar or by pressing Ctrl+Alt+T. Once the terminal is open, you'll use a command to start Wireshark. In the terminal, type the following command and press Enter:
wireshark
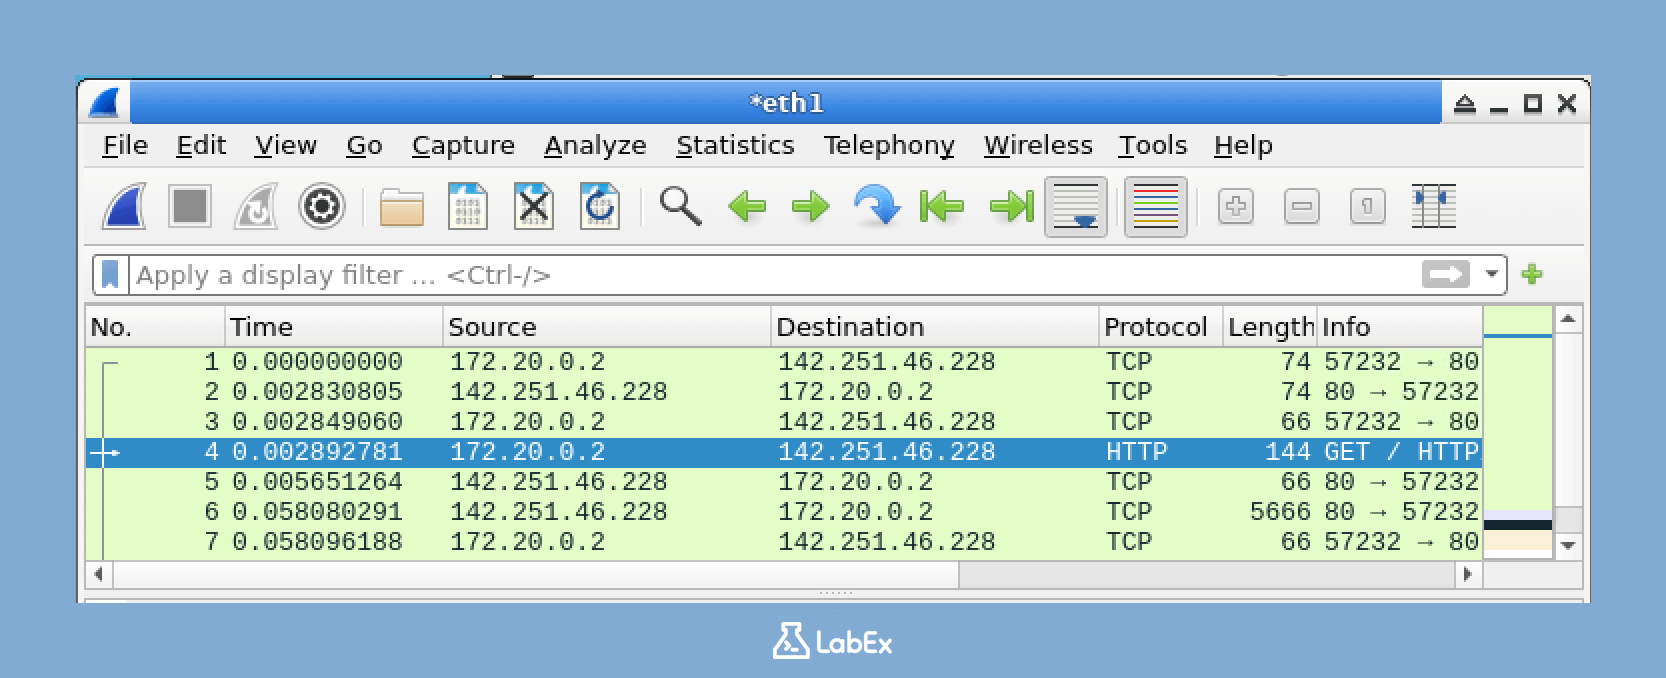
This command tells your system to start the Wireshark application. After a few seconds, Wireshark will open. You should see a window similar to the one shown below:
How to Work with Network Capture Files
For this part of the tutorial, you have two options:
Option 1: Use the Provided Sample File
# Download a sample packet capture file with mixed traffic
wget -q https://s3.amazonaws.com/tcpreplay-pcap-files/smallFlows.pcap -O /home/labex/project/sample.pcapng

# Make sure the user has access to the file
chmod 644 /home/labex/project/sample.pcapng
I’ve prepared a sample capture file for you at /home/labex/project/sample.pcapng. This file contains a variety of network traffic that you can analyze.
To open this file:
In Wireshark, go to File > Open
Navigate to
/home/labex/project/sample.pcapngClick "Open"
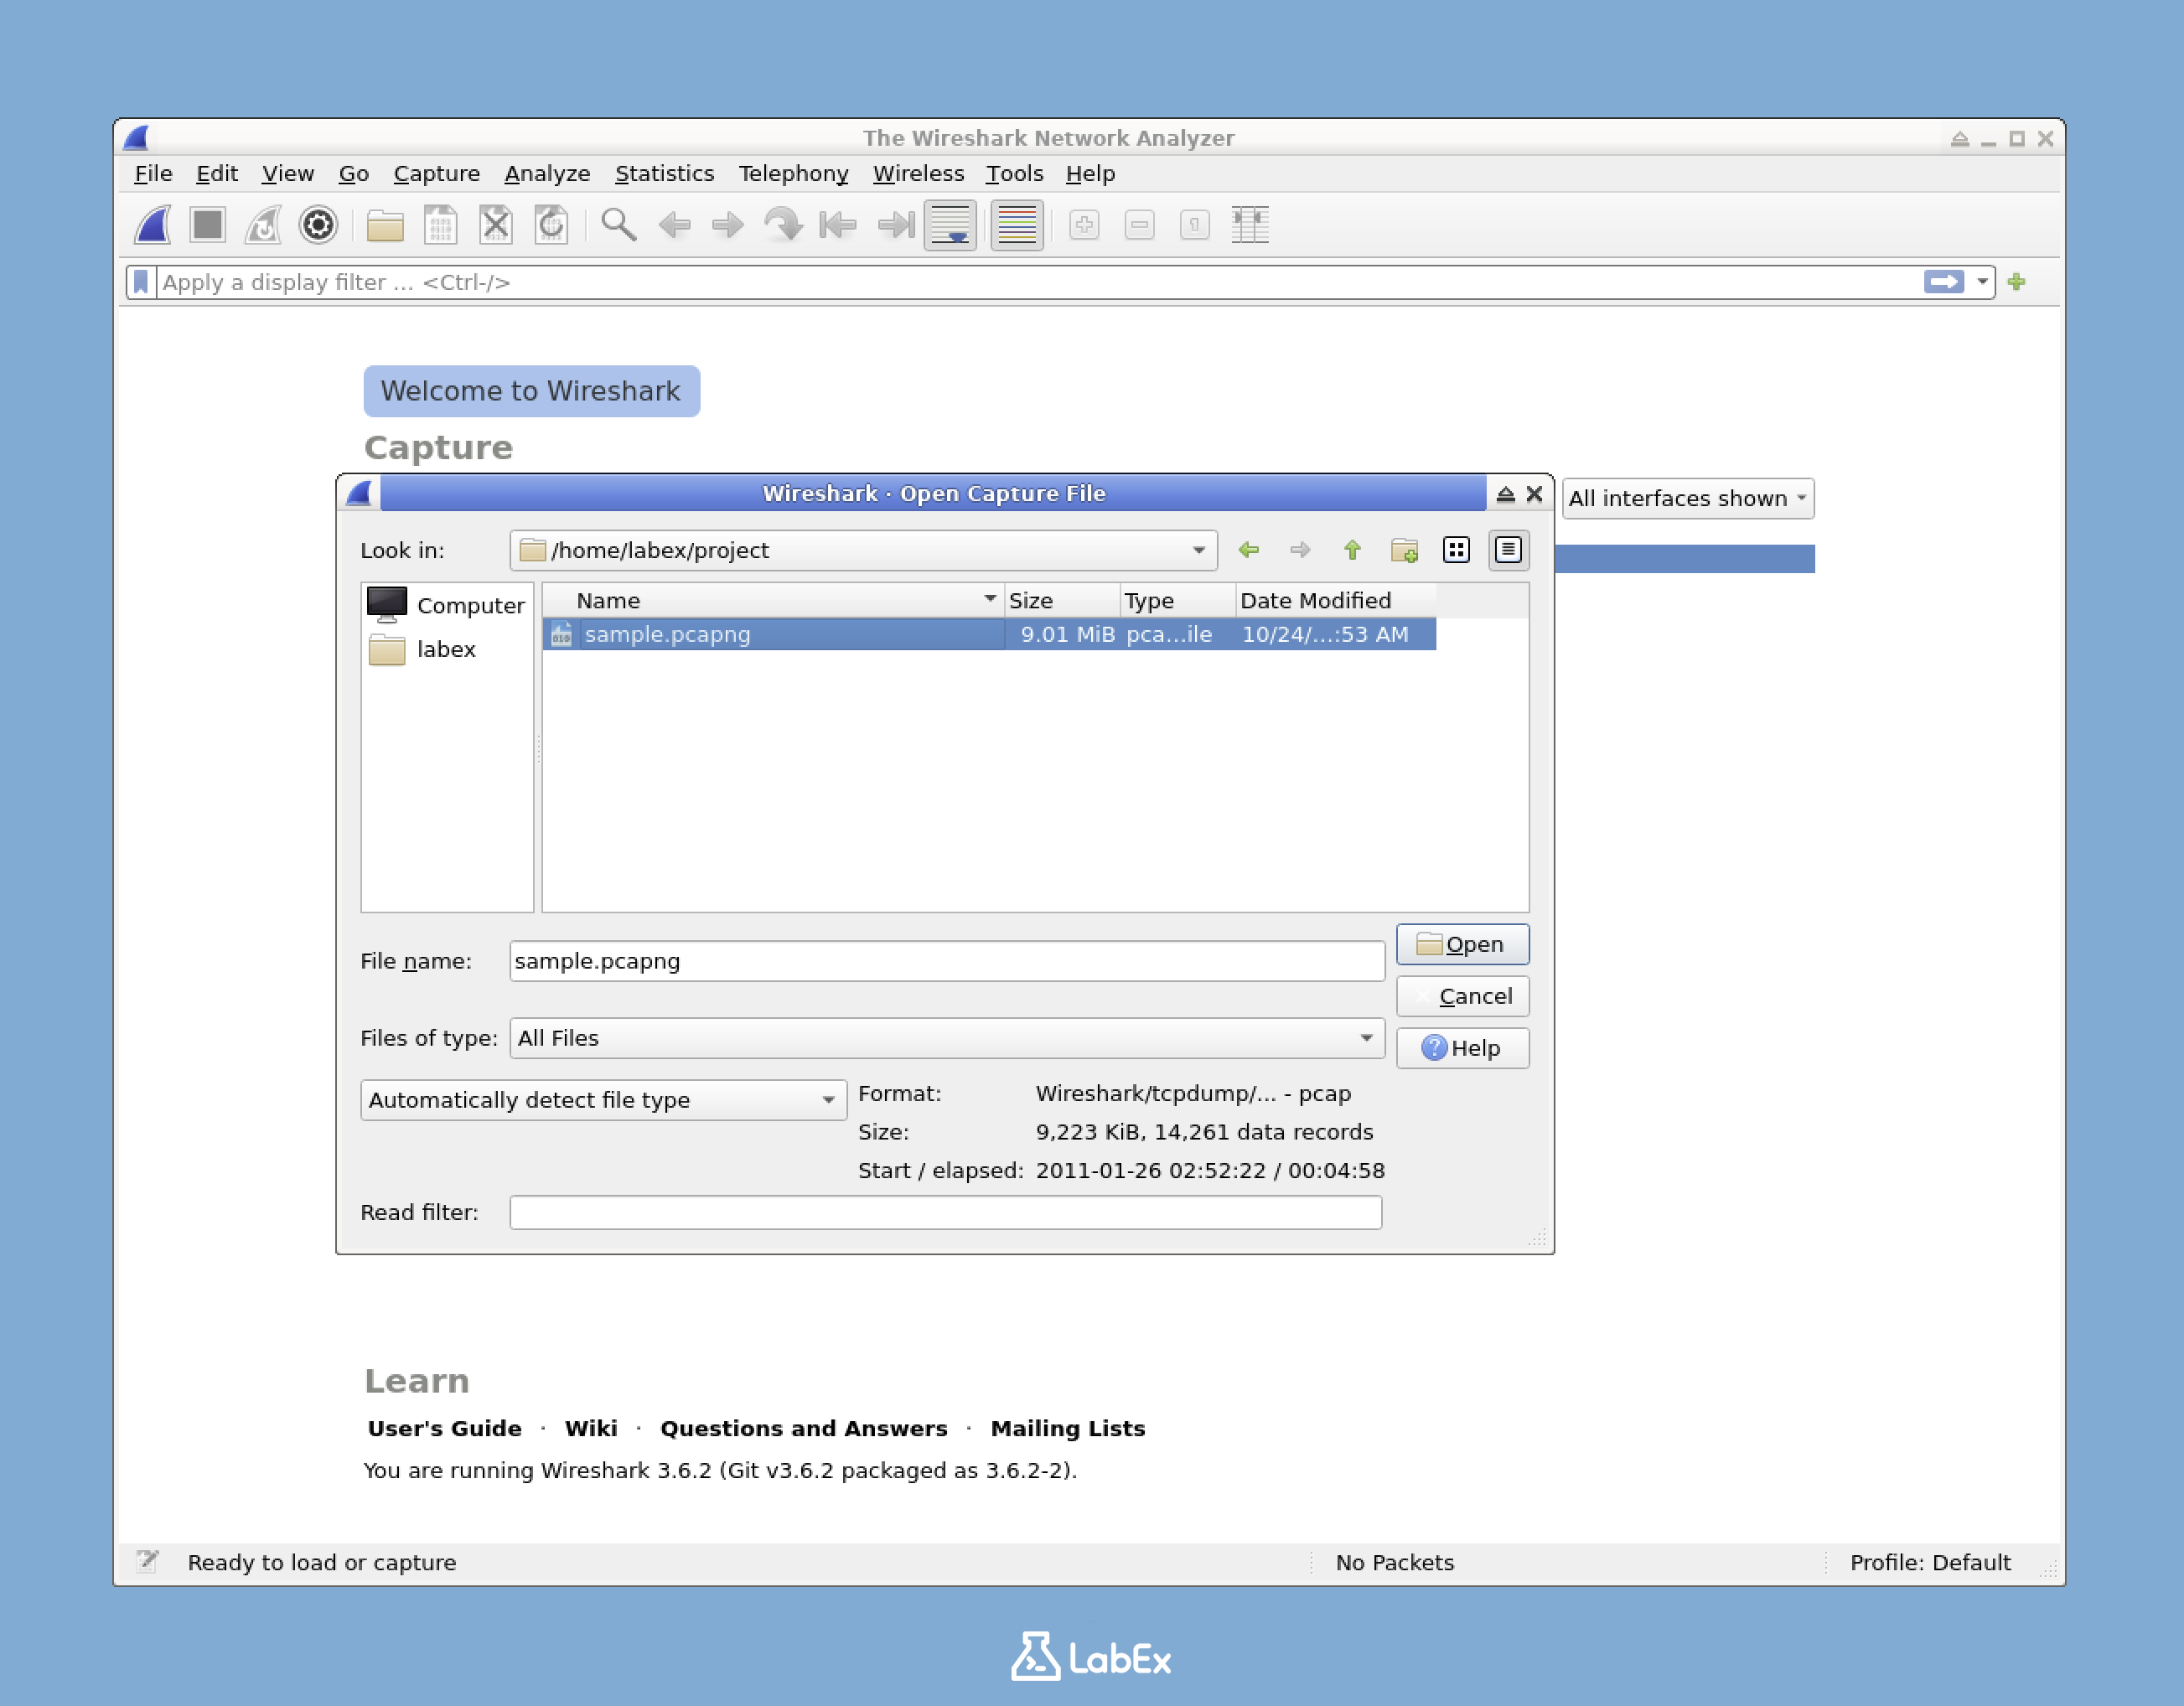
The file will load in Wireshark, showing various packets that have been captured previously.
Option 2: Capture Your Own Traffic
If you prefer to capture your own traffic:
In the Wireshark main window, look for the list of available network interfaces.
Find the
eth1interface. In this lab environment,eth1is the main network interface we'll use for capturing packets.Double-click on
eth1. This action immediately starts the packet capture process.Generate some network traffic by opening a new terminal and running:
curl www.google.comOnce you've captured enough packets (aim for at least 20-30 packets), click the red square "Stop" button in the Wireshark toolbar.
Understanding the Wireshark Interface
The Wireshark interface is divided into three main panels, each with a specific purpose:
Packet List (top panel): This panel shows all the packets that have been captured in the order they were received. It gives you a quick overview of the captured traffic.
Packet Details (middle panel): When you select a packet in the top panel, this middle panel shows the details of that packet in a hierarchical format. It breaks down the packet's structure, showing information like the source and destination IP addresses, protocol types, and more.
Packet Bytes (bottom panel): This panel displays the raw bytes of the selected packet in hexadecimal format. It's useful for in-depth analysis, especially when you need to look at the exact data being transmitted.
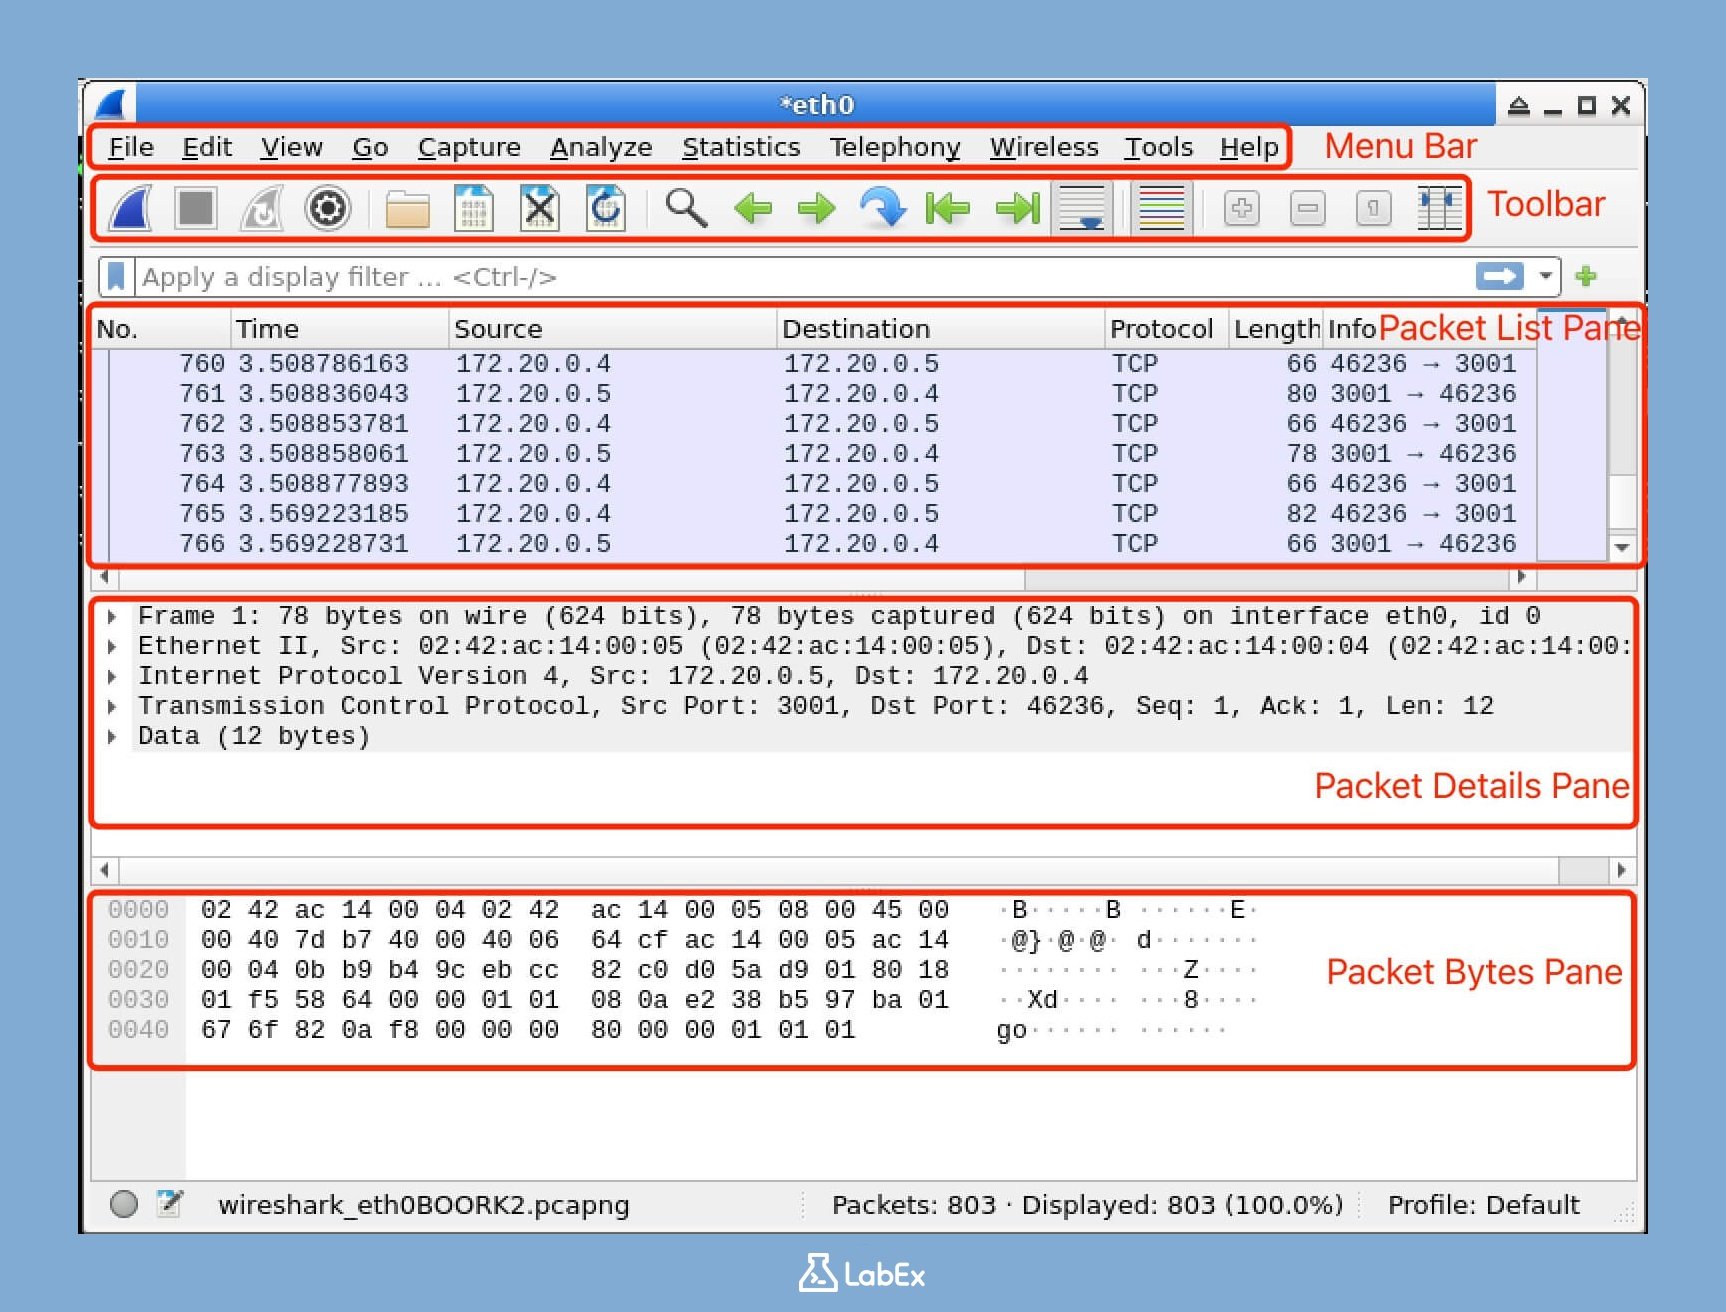
To see how these panels work together, click on different packets in the top panel. You'll see the corresponding details and raw bytes update in the middle and bottom panels.
Understanding and Applying Basic Display Filters
In this step, we're going to explore display filters in Wireshark. Display filters are essential tools when it comes to analyzing network traffic. They help you focus on specific types of packets instead of having to sift through all the captured data.
By the end of this section, you'll know what display filters are, why they're useful, and how to apply basic ones to isolate specific types of network traffic.
What Are Display Filters?
When you're analyzing network traffic, looking at every single captured packet can be overwhelming. You usually want to focus on specific types of packets. That's where Wireshark display filters come in. They allow you to show only the packets that meet certain criteria. This makes the analysis process much more efficient because you're not wasting time on irrelevant data.
Display filters in Wireshark use a special syntax. This syntax enables you to filter packets based on various attributes such as protocols, IP addresses, ports, and even the content of the packets. Understanding this syntax is key to effectively using display filters.
Filter Toolbar
Take a look at the top of the Wireshark window. You'll notice a text field. It might be labeled "Apply a display filter..." or simply show "Expression...". This is the place where you'll enter your display filters. Once you enter a filter and press Enter, Wireshark will use that filter to show only the relevant packets.
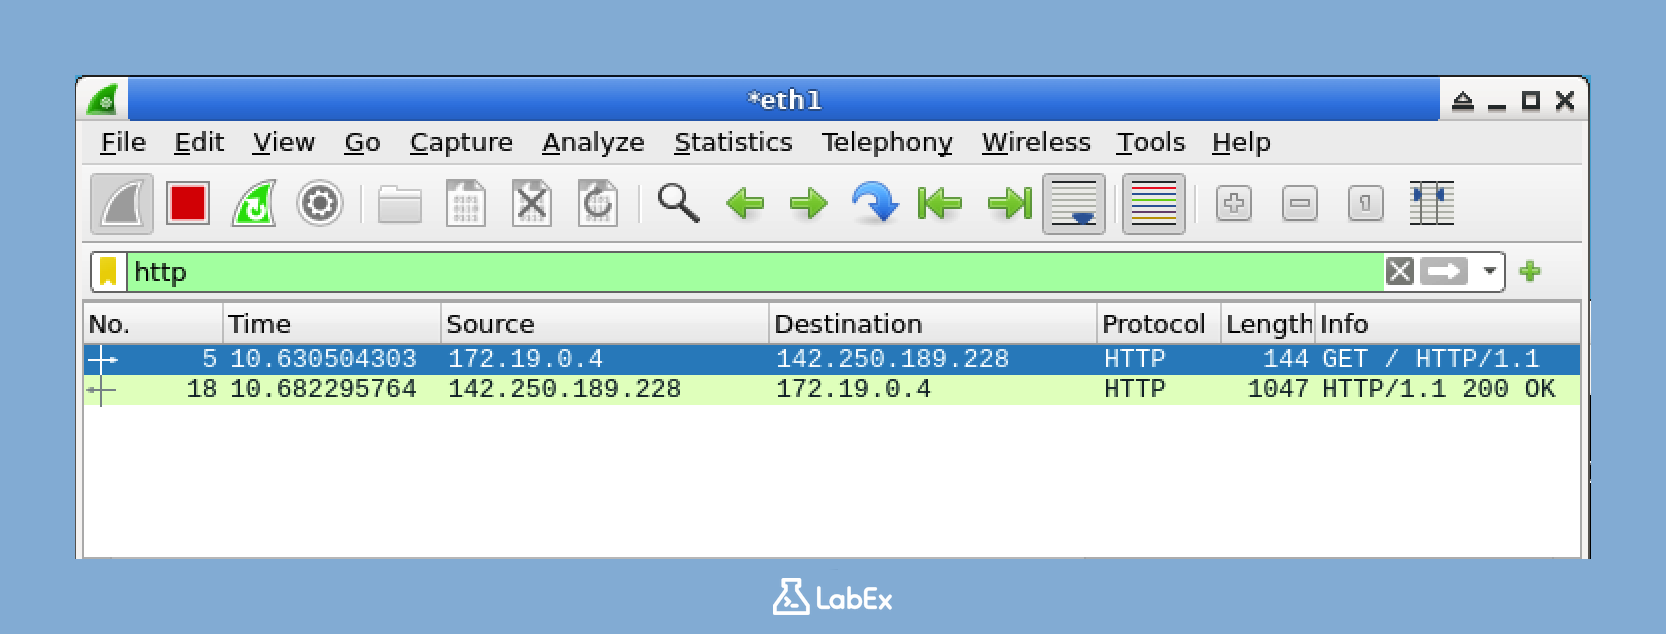
Basic Protocol Filters
Let's start with a simple example. Suppose you want to view only HTTP traffic. HTTP is the protocol used for web browsing. To do this, you'll enter a filter in the filter toolbar. Type the following filter and then press Enter:
http
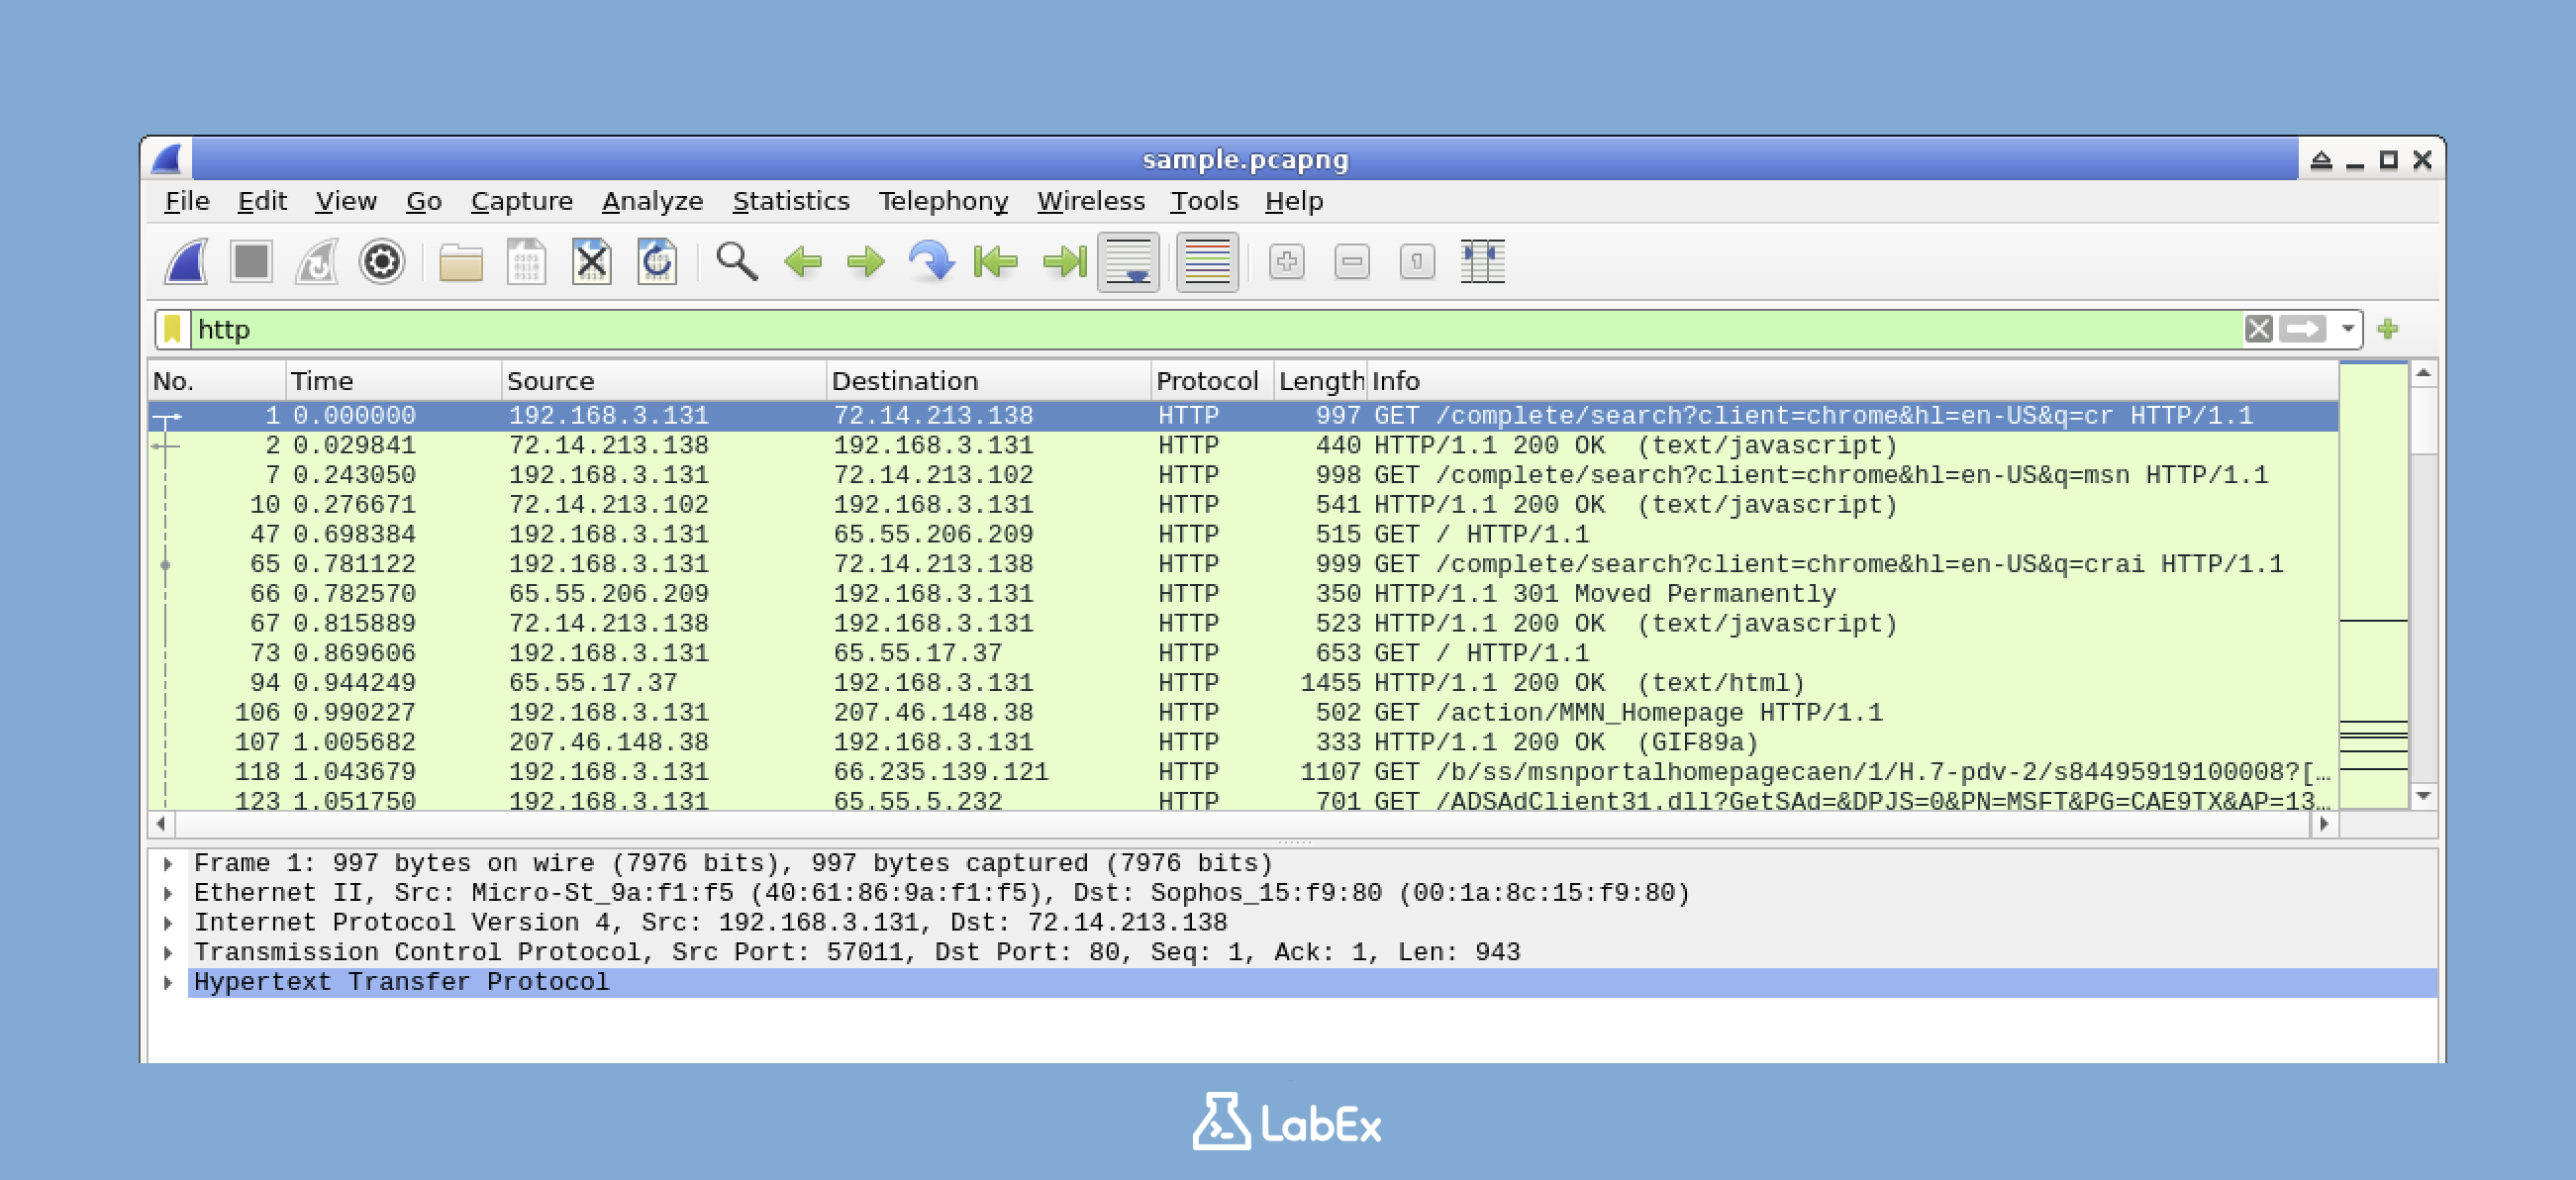
After you apply this filter, Wireshark will only display HTTP packets. All other packets will be temporarily hidden. You'll notice that the filter bar turns green when you apply a valid filter. This is a visual indication that your filter is working correctly.
The output should now show only packets related to HTTP traffic. This typically includes web requests (when you ask a website for information) and responses (when the website sends you the information). If you don't see any HTTP traffic in the sample file, you can try different protocols that might be present, such as TCP, UDP, or DNS:
tcp
Or try generating more HTTP traffic by running the curl command in a terminal:
curl www.google.com
IP Address Filters
Next, let's filter traffic based on IP addresses. An IP address is like a unique identifier for a device on a network. First, look at your packet list. You'll see columns labeled "Source" and "Destination". These columns show the IP addresses of the devices sending and receiving the packets.
Once you've identified an IP address that appears frequently in your capture (for example, let's say you see 192.168.1.1), you can use it to create a filter. Type the following filter in the filter toolbar to see only packets from that source:
ip.src == 192.168.3.131
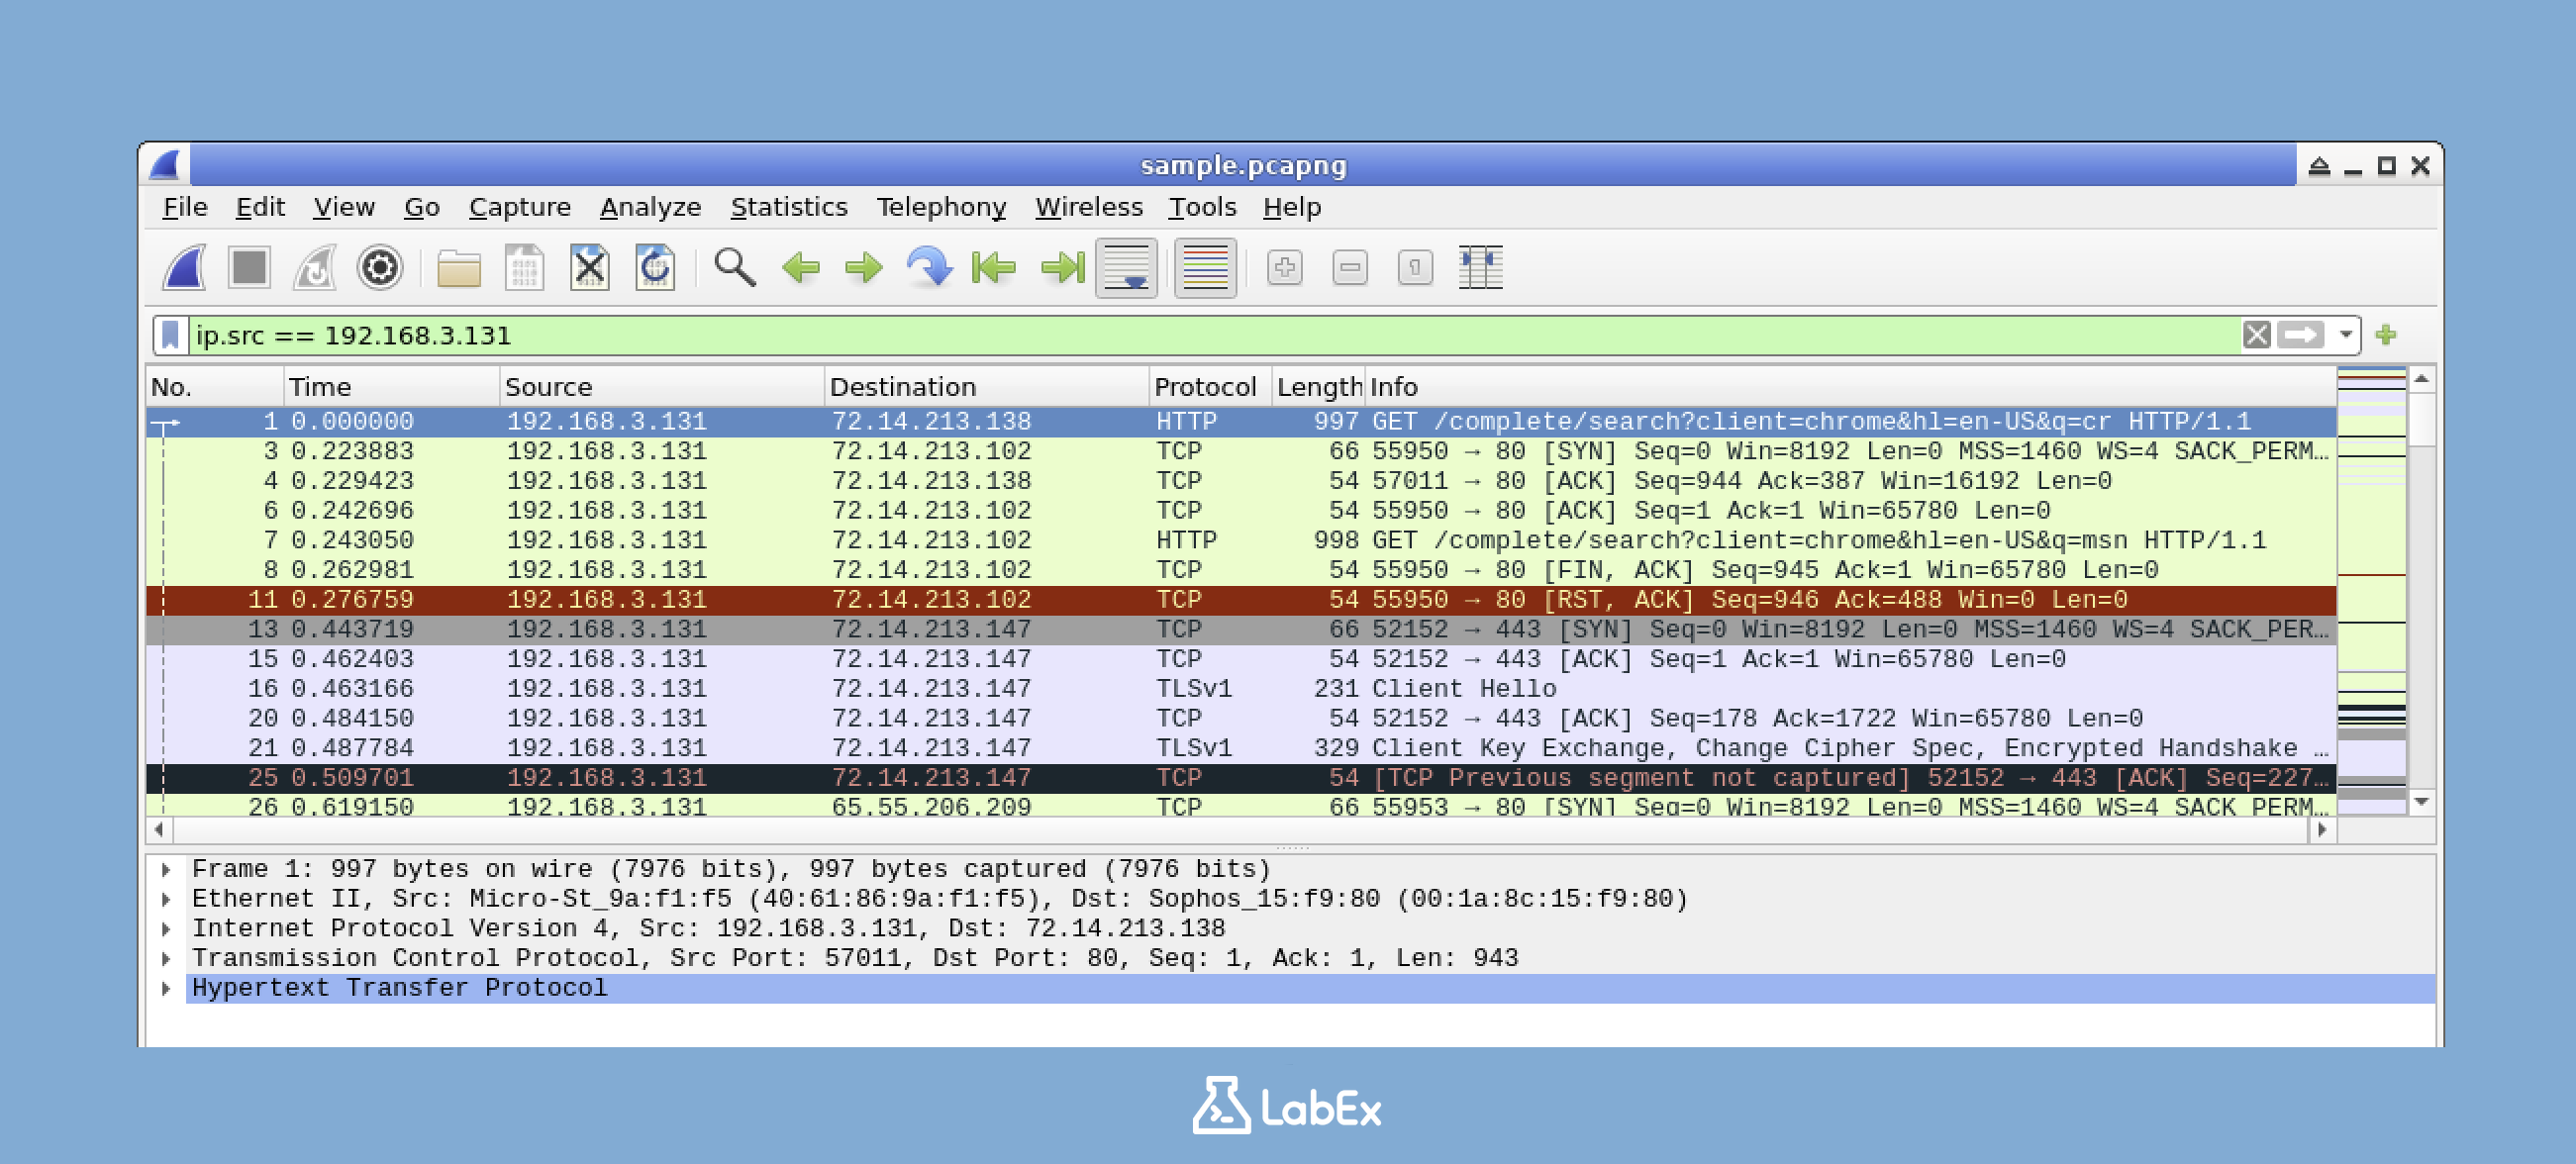
You can replace 192.168.3.131 with an IP address that you actually see in your capture. After applying this filter, only packets with that source IP address will be shown.
If you want to see all the packets again, you can clear the current filter. Just click the "Clear" button (X) on the right side of the filter bar.
Port Filters
Many network services operate on specific ports. A port is like a door on a device that allows specific types of network traffic to enter or leave. For example, HTTP typically uses port 80.
To filter packets by port number, you can use the following filter:
tcp.port == 80
This filter will show both incoming and outgoing packets that use TCP port 80. You might also try other common ports like 443 (HTTPS) or 53 (DNS) depending on what's available in your capture.
Combining Filters
You can make your filters more powerful by combining them using logical operators like and and or. For example, if you want to show only HTTP traffic that uses port 80, you can use the following filter:
http and tcp.port == 80
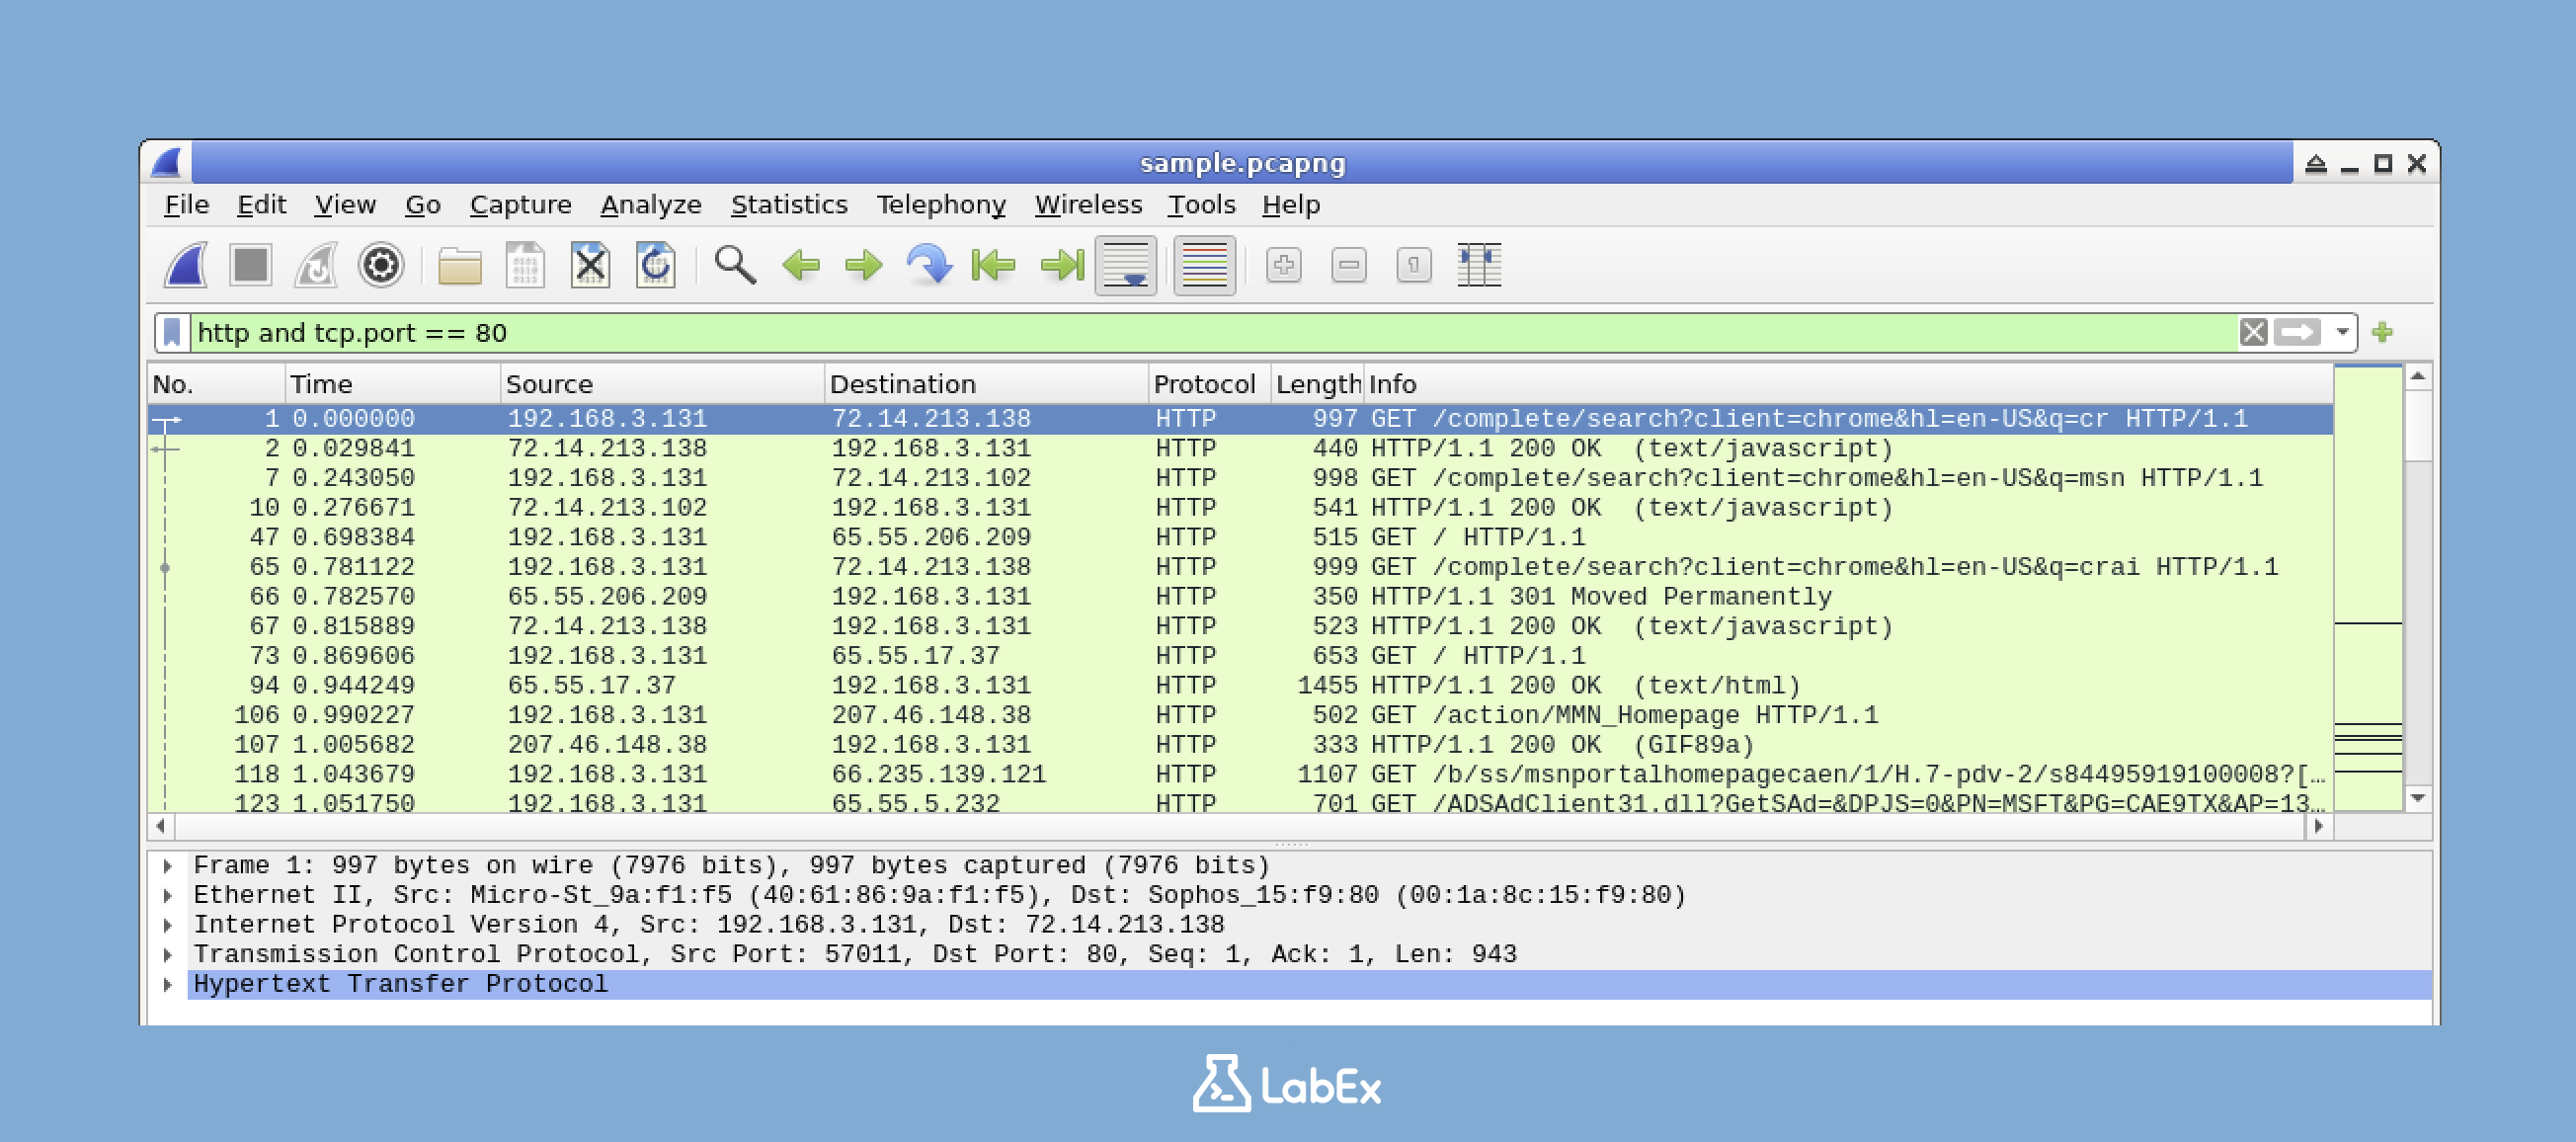
Try applying different combinations of filters and observe how the displayed packets change. Remember, before trying a new filter, you can either clear the previous one by clicking the "Clear" button or modify the existing filter directly in the filter bar to build upon it.
Advanced Filtering Techniques
In this part, we'll explore how to create more sophisticated filters for detailed network traffic analysis. As a beginner, you might wonder why we need advanced filtering. Well, in real-world scenarios, network capture files can be extremely large, filled with all kinds of traffic. Advanced filtering techniques are like a powerful magnifying glass for security professionals. They help us quickly pick out the suspicious or important traffic from the sea of data in these large capture files.
Complex Filters with Multiple Conditions
Wireshark gives you the ability to build complex filters by combining multiple conditions. This is very useful when you want to be more precise in your traffic analysis. Let's start by creating a filter to find HTTP GET requests.
http.request.method == "GET"
This filter is designed to display only HTTP packets that contain GET requests. When you apply this filter, you'll see packets that are requests sent to web servers. The reason we use this filter is that GET requests are a common type of HTTP request used to retrieve data from a server. By isolating these requests, we can focus on the data retrieval activities in the network.
If your sample file doesn't contain HTTP GET requests, try this alternative filter to find TCP SYN packets which indicate connection attempts:
tcp.flags.syn == 1
Now, let's make our filter more specific. We'll add a port condition:
tcp.port == 80 and http.request.method == "GET"
This new filter shows only HTTP GET requests that occur on the standard HTTP port (80). The standard HTTP port is widely used for unencrypted web traffic. By adding this port condition, we're narrowing down our search to only those GET requests that are using the typical HTTP communication channel.
Filtering Based on Packet Size
Network attacks often involve packets with unusual sizes. Attackers might use large or small packets to hide malicious data or to disrupt the normal functioning of the network. To filter based on packet size, we use a specific syntax:
tcp.len >= 100 and tcp.len <= 500
This filter displays TCP packets with a payload length between 100 and 500 bytes. You can adjust these values according to your needs. For example, if you suspect that an attack involves larger packets, you can increase the upper limit. By filtering based on packet size, we can identify abnormal traffic patterns that might indicate an attack.
Filtering Based on Specific Content
You can also filter traffic based on specific content within packets. This is very useful when you're looking for traffic related to a particular website or service. For example, let's find HTTP traffic related to a specific website.
http.host contains "google"
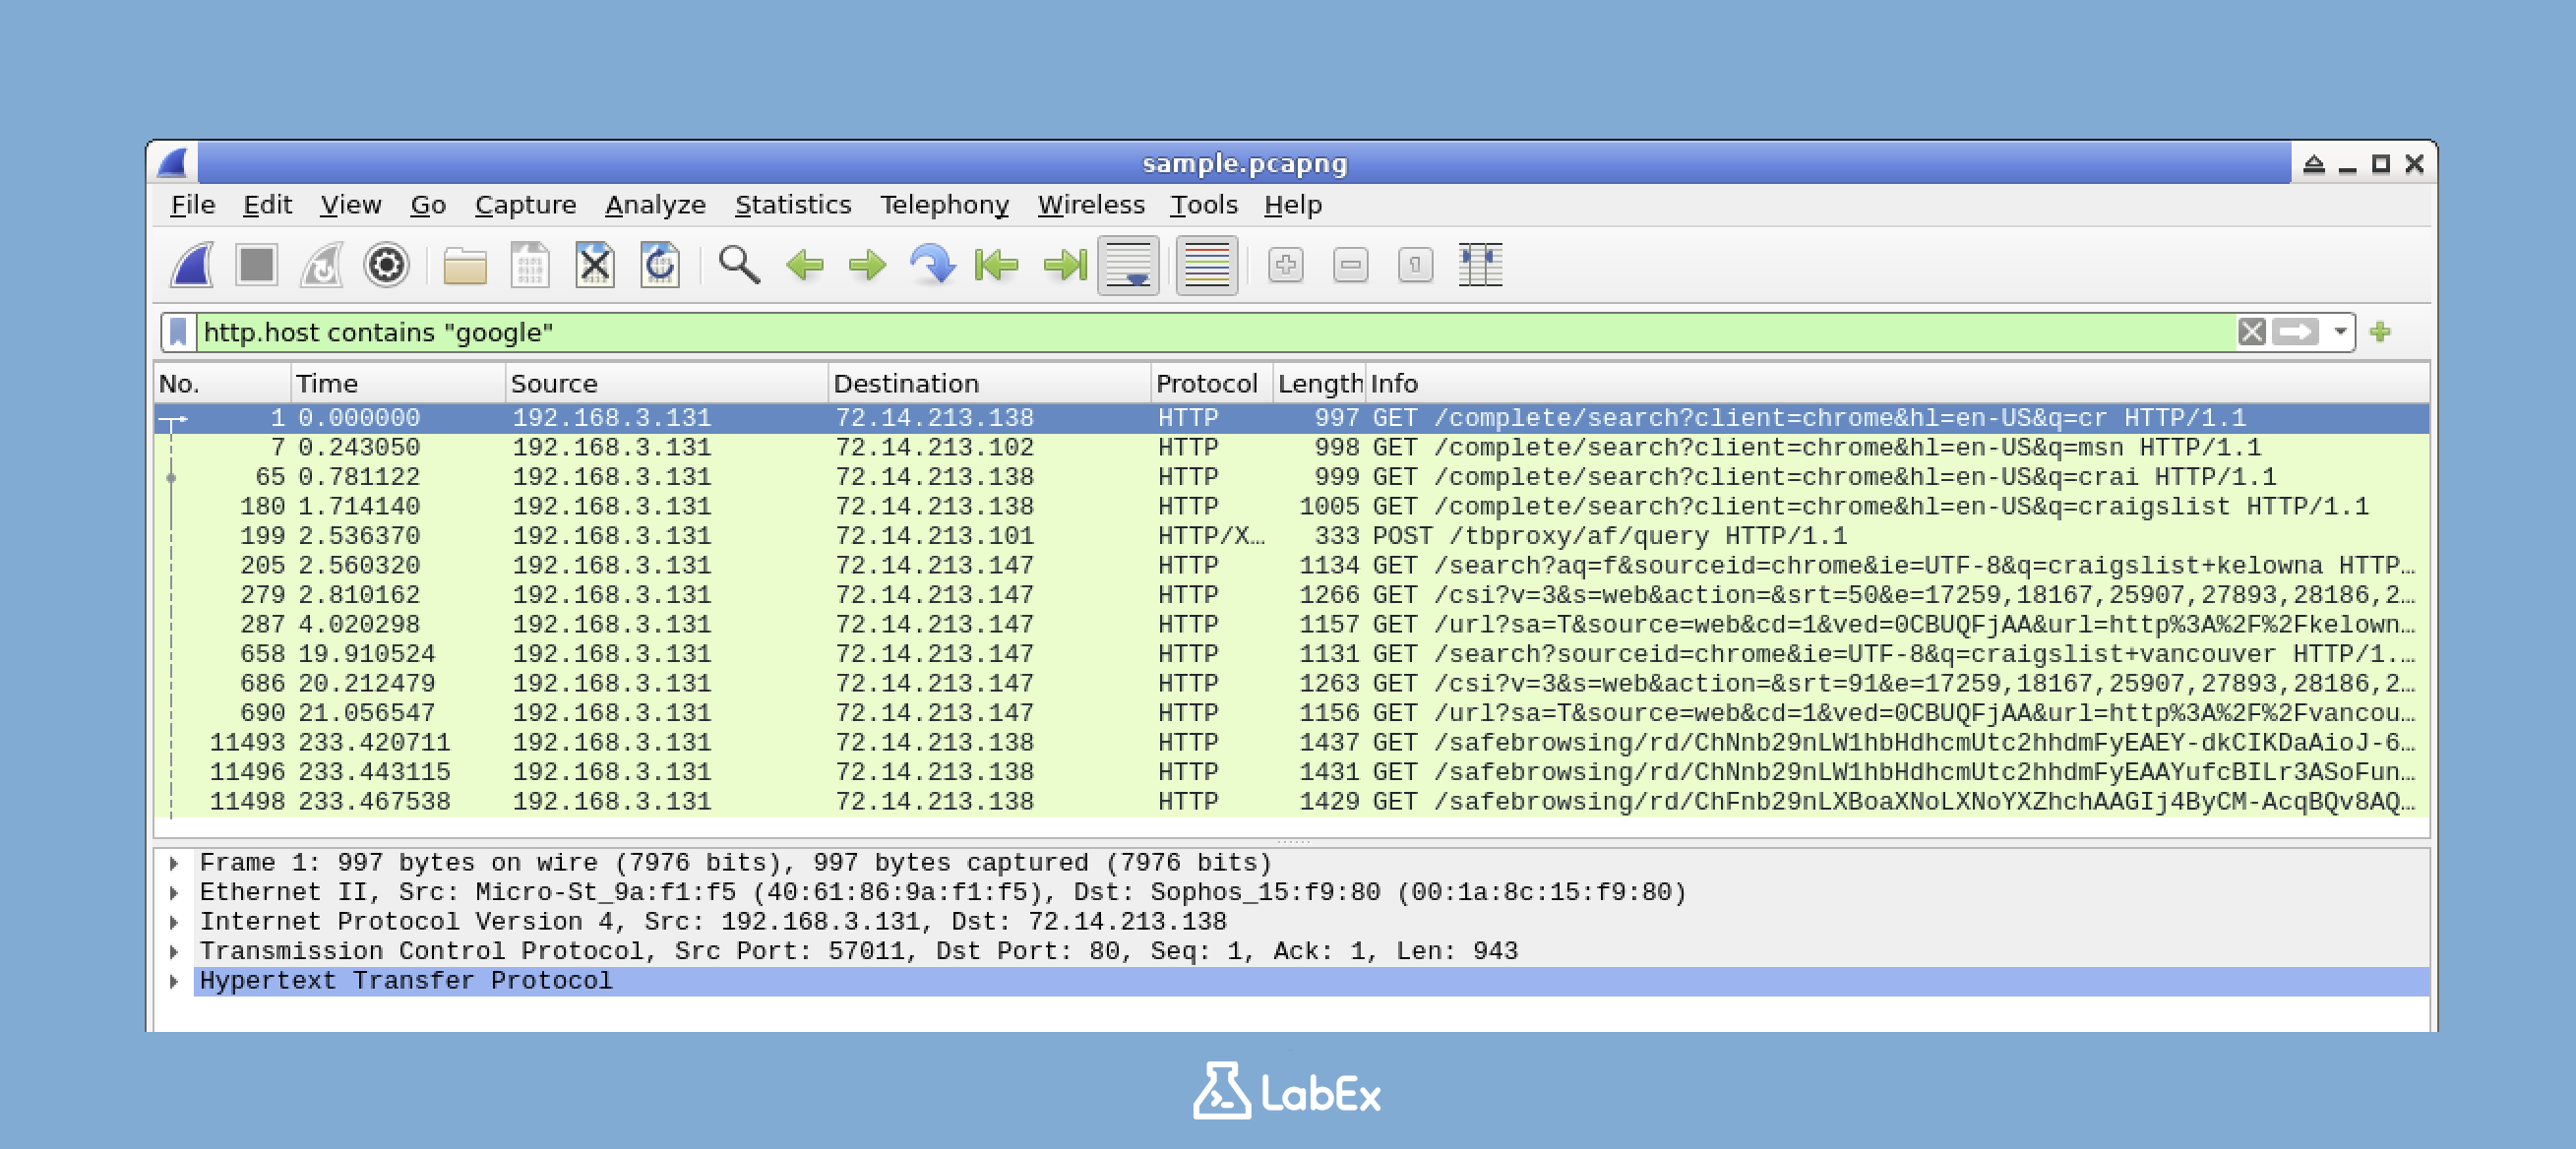
This filter shows only HTTP traffic where the host header contains "google". You can replace "google" with any domain you're interested in analyzing. The host header in an HTTP request tells the server which website the client is trying to access. By filtering based on the host header, we can focus on the traffic related to a specific domain.
If your sample file doesn't have HTTP traffic with host headers, try this more general content filter:
frame contains "http"
Using the "contains" Operator for Text Searching
The contains operator is a handy tool for searching for specific text strings in packets. It allows us to look for certain keywords within the packet data.
frame contains "password"
This filter shows packets containing the word "password" anywhere in the packet data. This can be very helpful for detecting possible security issues. For example, if passwords are being sent in clear text (which is a big security risk), this filter can help us spot those packets.
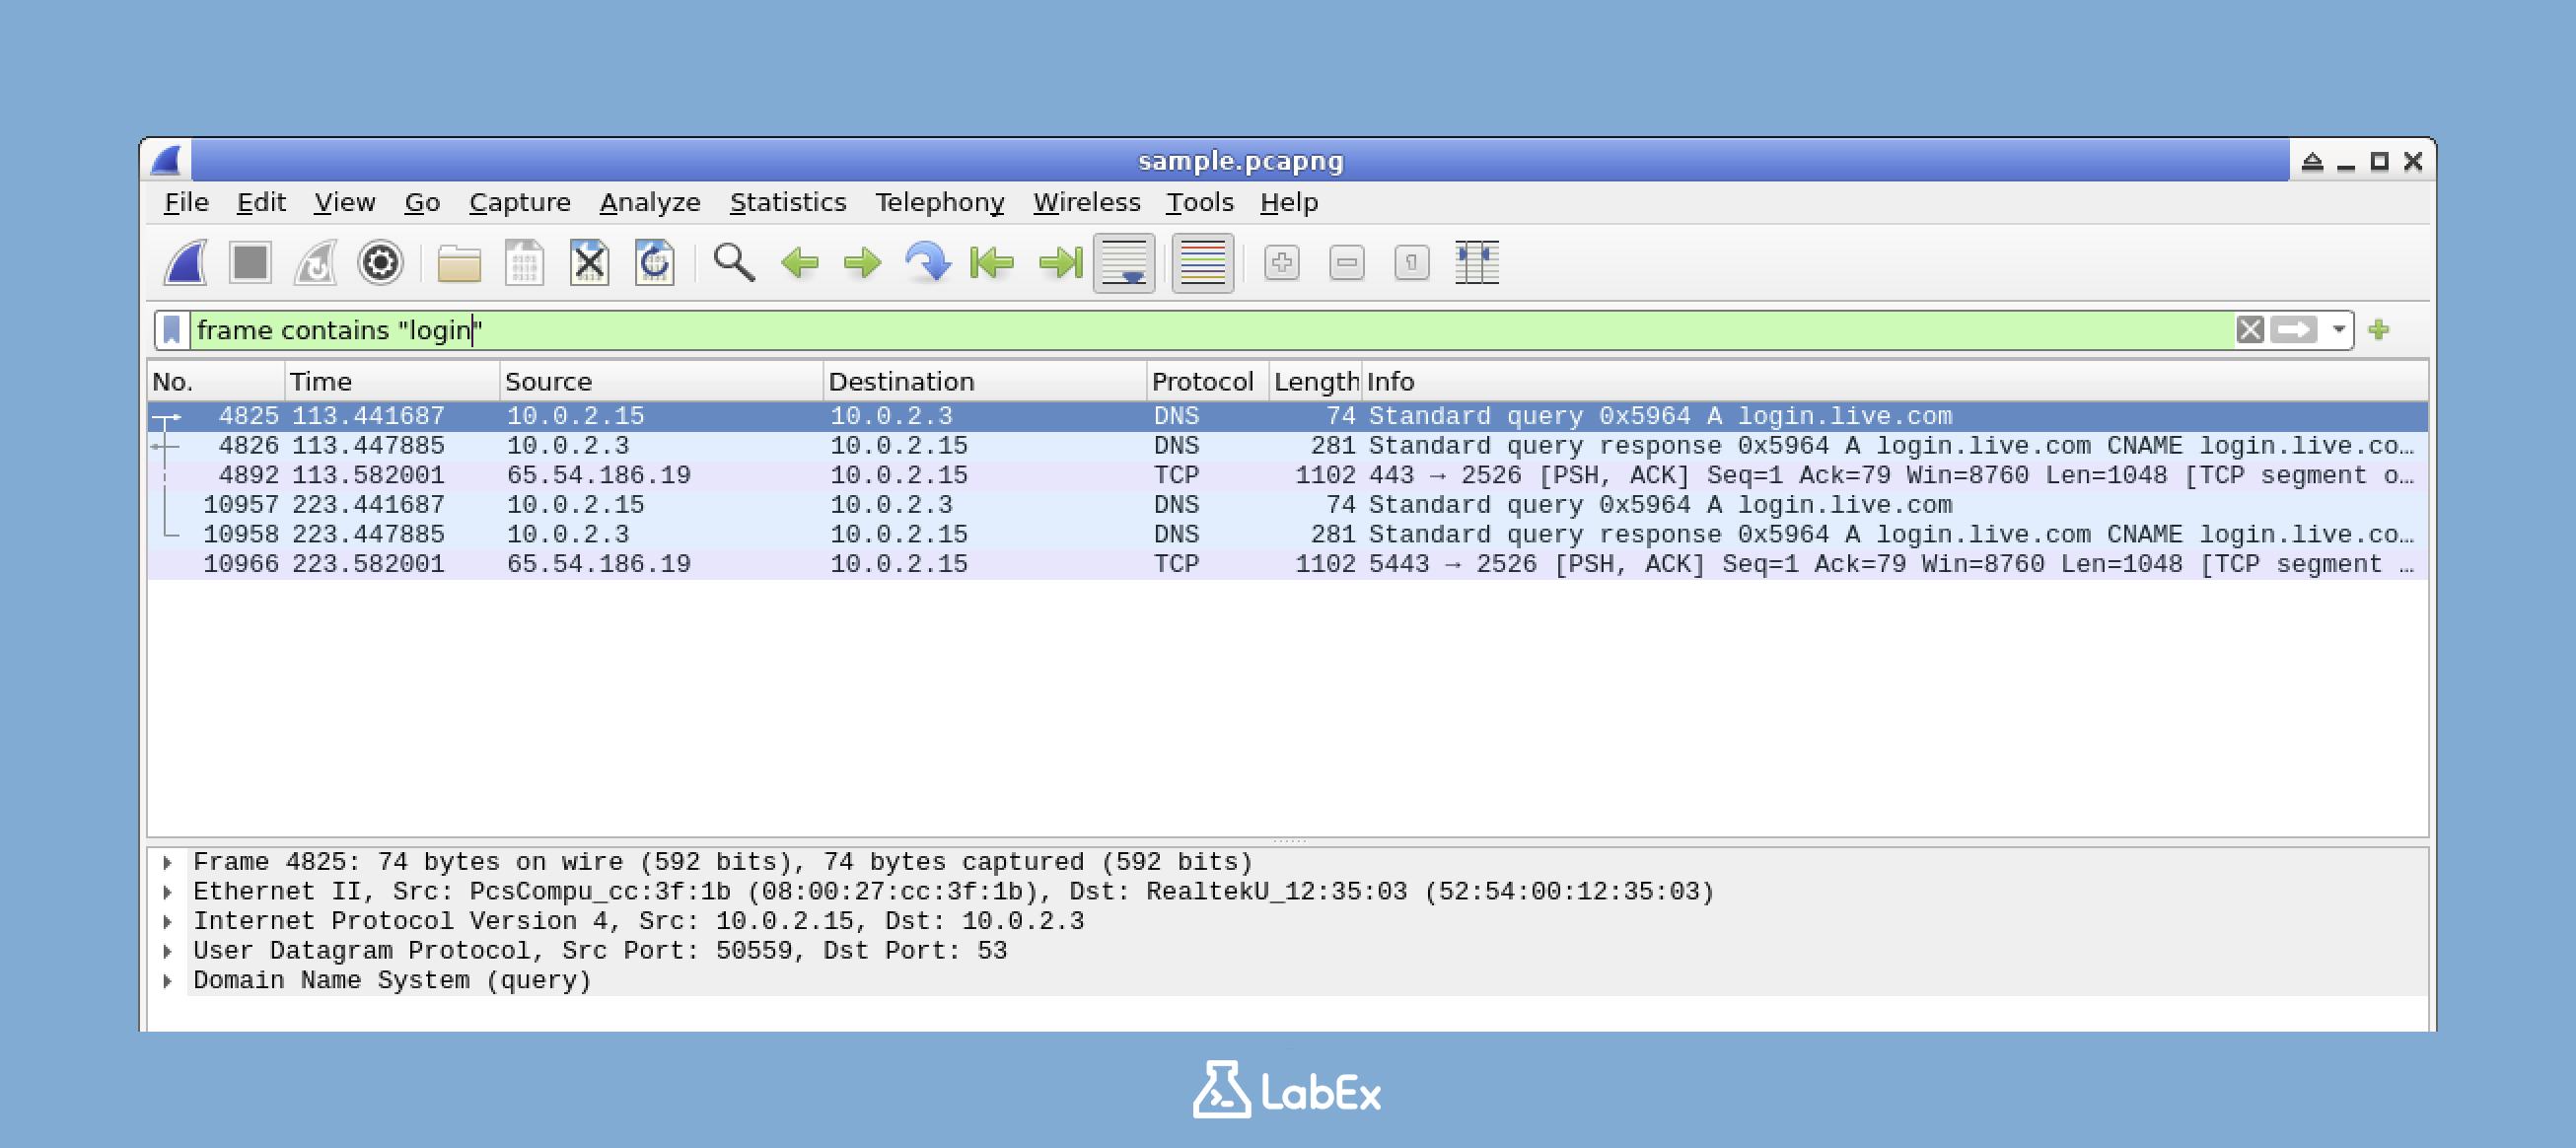
Or try this filter:
frame contains "login"
Negating Filters
Sometimes, you might want to see all the traffic except for certain types. That's where the not operator comes in.
not arp
This filter hides all ARP packets. ARP (Address Resolution Protocol) is used to map IP addresses to MAC addresses in a local network. Sometimes, ARP traffic can be very common and might clutter your analysis. By using the not operator, you can exclude this type of traffic and focus on other more relevant packets.
Saving and Applying Filter Bookmarks
If you find yourself using certain filters frequently, you don't have to type them in every time. You can save them as bookmarks. Here's how:
Enter a filter in the filter bar. This is where you type in the filter expressions we've been learning about.
Click the "+" button on the right side of the filter bar. This button is used to save the current filter as a bookmark.
Give your filter a name and click "OK". Naming the filter makes it easy to identify later.
Once you've saved your filter, you can apply it by clicking on its name in the filter dropdown menu. This saves you time and effort, especially when you're doing repeated analysis.
Exporting Filtered Packets
After you've filtered your traffic to show only the packets of interest, you might want to save just these packets to a new file. This is useful for sharing specific findings with colleagues or for further analysis. Here's how you do it:
Apply your desired filter. Make sure you've set up the filter to show only the packets you want to save.
Click on File > Export Specified Packets. This option allows you to export a specific set of packets.
Make sure "Displayed" is selected in the Packet Range section. This ensures that only the packets that are currently visible (that is, the ones that match your filter) are exported.
Choose a filename and location. This is where you decide where to save the new capture file and what to name it.
Click "Save". This creates a new capture file containing only the packets that matched your filter.
Analyzing Security-Related Traffic
In this step, we're going to focus on using Wireshark filters for security analysis. Security analysis is crucial in the world of cybersecurity as it helps us spot potentially malicious activities in network traffic. By the end of this section, you'll be able to identify various types of security threats using specific Wireshark filters.
Identifying Port Scanning Activities
Port scanning is a common technique used by attackers to gather information about a target system. Attackers use it to find open ports on a network, which they can then exploit.
To detect potential port scanning, we look for a large number of connection attempts from a single source to multiple ports.
Let's use a specific filter to identify such activities. Try this filter in Wireshark:
tcp.flags.syn == 1 and tcp.flags.ack == 0
This filter shows SYN packets without the ACK flag. In a TCP connection, the SYN packet is the first one sent to initiate a connection, and the ACK packet is used to acknowledge the connection. When we see a lot of SYN packets without ACK from one source to different destination ports, it's a strong indication of port scanning.
Detecting Suspicious DNS Traffic
DNS tunneling and other DNS-based attacks are becoming more common. These attacks use the DNS protocol to hide malicious activities, such as data exfiltration or command and control communication. To detect such attacks, we need to look for unusual DNS traffic.
Use this filter to examine DNS queries:
dns
Once you apply this filter, look for unusually long domain names or a high volume of DNS requests to the same domain. These could be signs of data exfiltration or command and control communication.
Identifying Password Brute Force Attempts
Password brute force attacks are a common way for attackers to gain unauthorized access to services like SSH or FTP. In a brute force attack, the attacker tries multiple password combinations until they find the correct one.
To detect potential brute force password attempts, we can filter for failed login attempts. Use this filter:
ftp contains "530" or ssh contains "Failed"
This filter shows FTP and SSH packets that contain common failure response messages. If you see multiple failures from the same source, it may indicate a brute force attempt.
Analyzing HTTP Error Responses
Web application attacks often generate HTTP error responses. Attackers may try to exploit vulnerabilities in web applications, and these attempts can result in error responses from the server.
Filter for these error responses with:
http.response.code >= 400
This filter shows HTTP response packets with status codes of 400 or higher. All these status codes represent error responses. By examining these packets, we can identify attempted web exploits.
Finding Clear-Text Credentials
Transmitting credentials in clear text is a major security risk. If an attacker intercepts these credentials, they can gain unauthorized access to the system.
To detect clear-text credentials, use this filter:
http contains "user" or http contains "pass" or http contains "login"
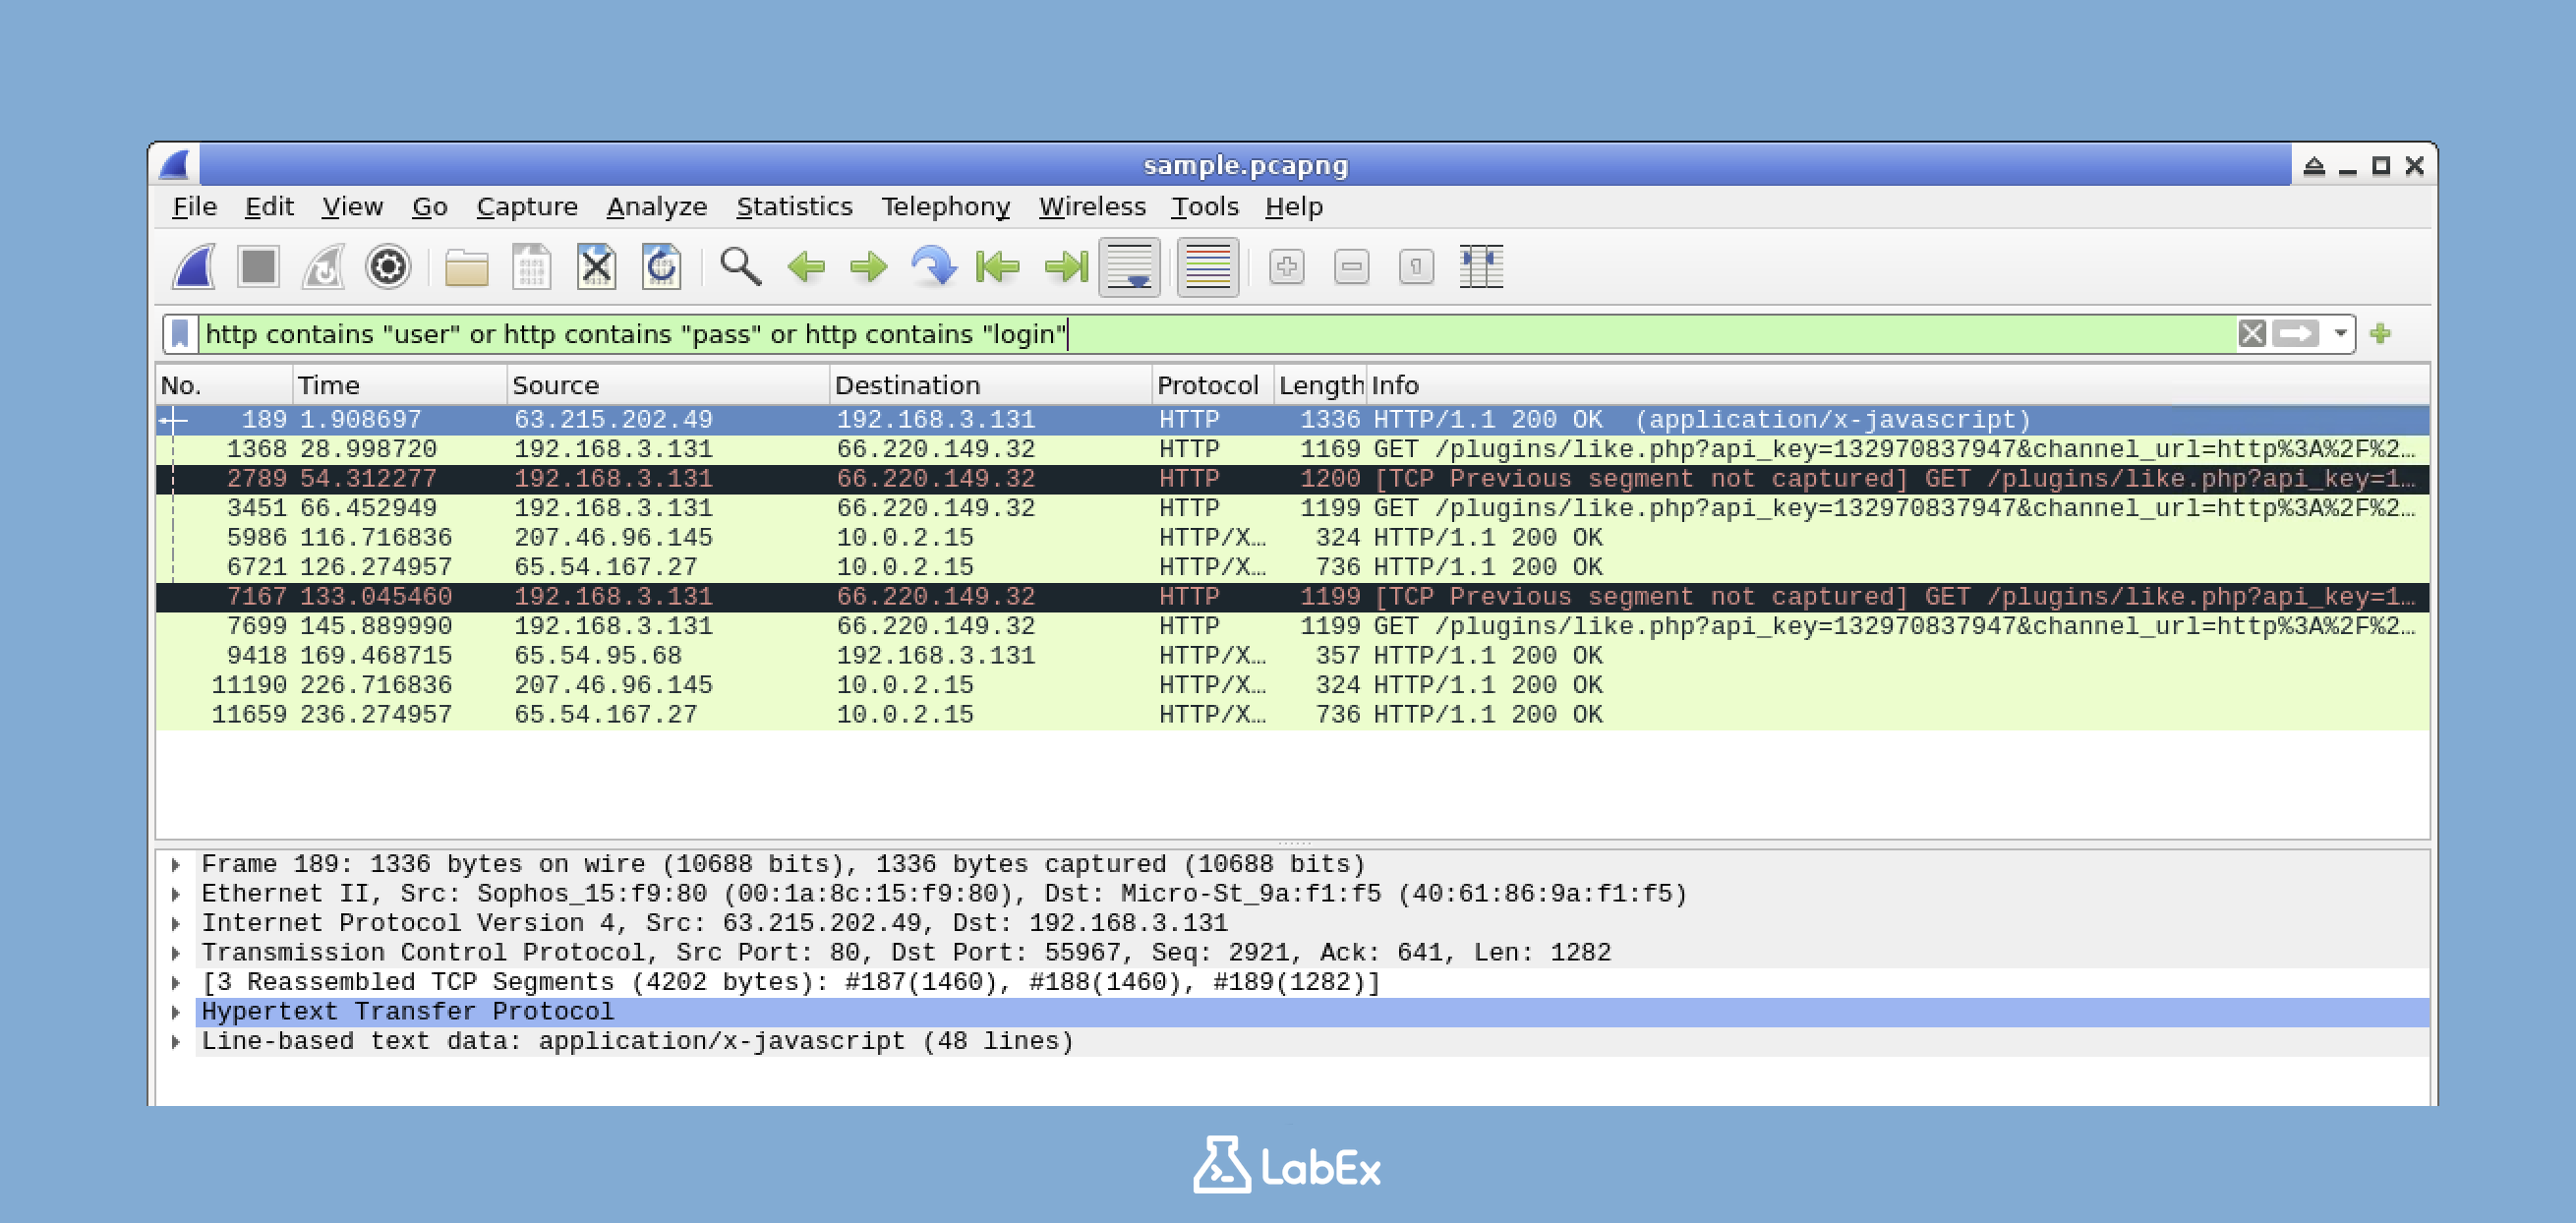
This filter helps us find HTTP traffic that might contain login information. Carefully examine the packets that match this filter to identify potential security risks.
Analyzing Sample Traffic and Generating New Traffic
Now that you've learned various security-focused filters, it's time to put your knowledge into practice. You can either analyze the provided sample file or generate and analyze new traffic.
Analyzing the Sample File
If you're using the provided sample file (/home/labex/project/sample.pcapng), try applying some of the security filters we've discussed to identify any interesting patterns:
tcp.flags.syn == 1 and tcp.flags.ack == 0
Look for patterns that might indicate scanning, suspicious connections, or other security concerns.
Generating and Analyzing New Traffic
Alternatively, open a new terminal window. In this window, we'll generate some HTTP traffic with multiple requests. Run the following commands:
for i in {1..5}; do
  curl -I www.google.com
  sleep 1
done
These commands send five HTTP HEAD requests to www.google.com with a one-second interval between each request.
Next, go to Wireshark and apply this filter to find all HTTP requests:
http.request
This filter will show all the HTTP requests in the captured traffic.
Look through these packets to identify patterns of normal HTTP traffic. Notice the headers, the frequency of requests, and other details.
Finally, try to create a filter that can distinguish normal HTTP browsing from automated scanning tools. For example:
http.request and !(http.user_agent contains "Mozilla")
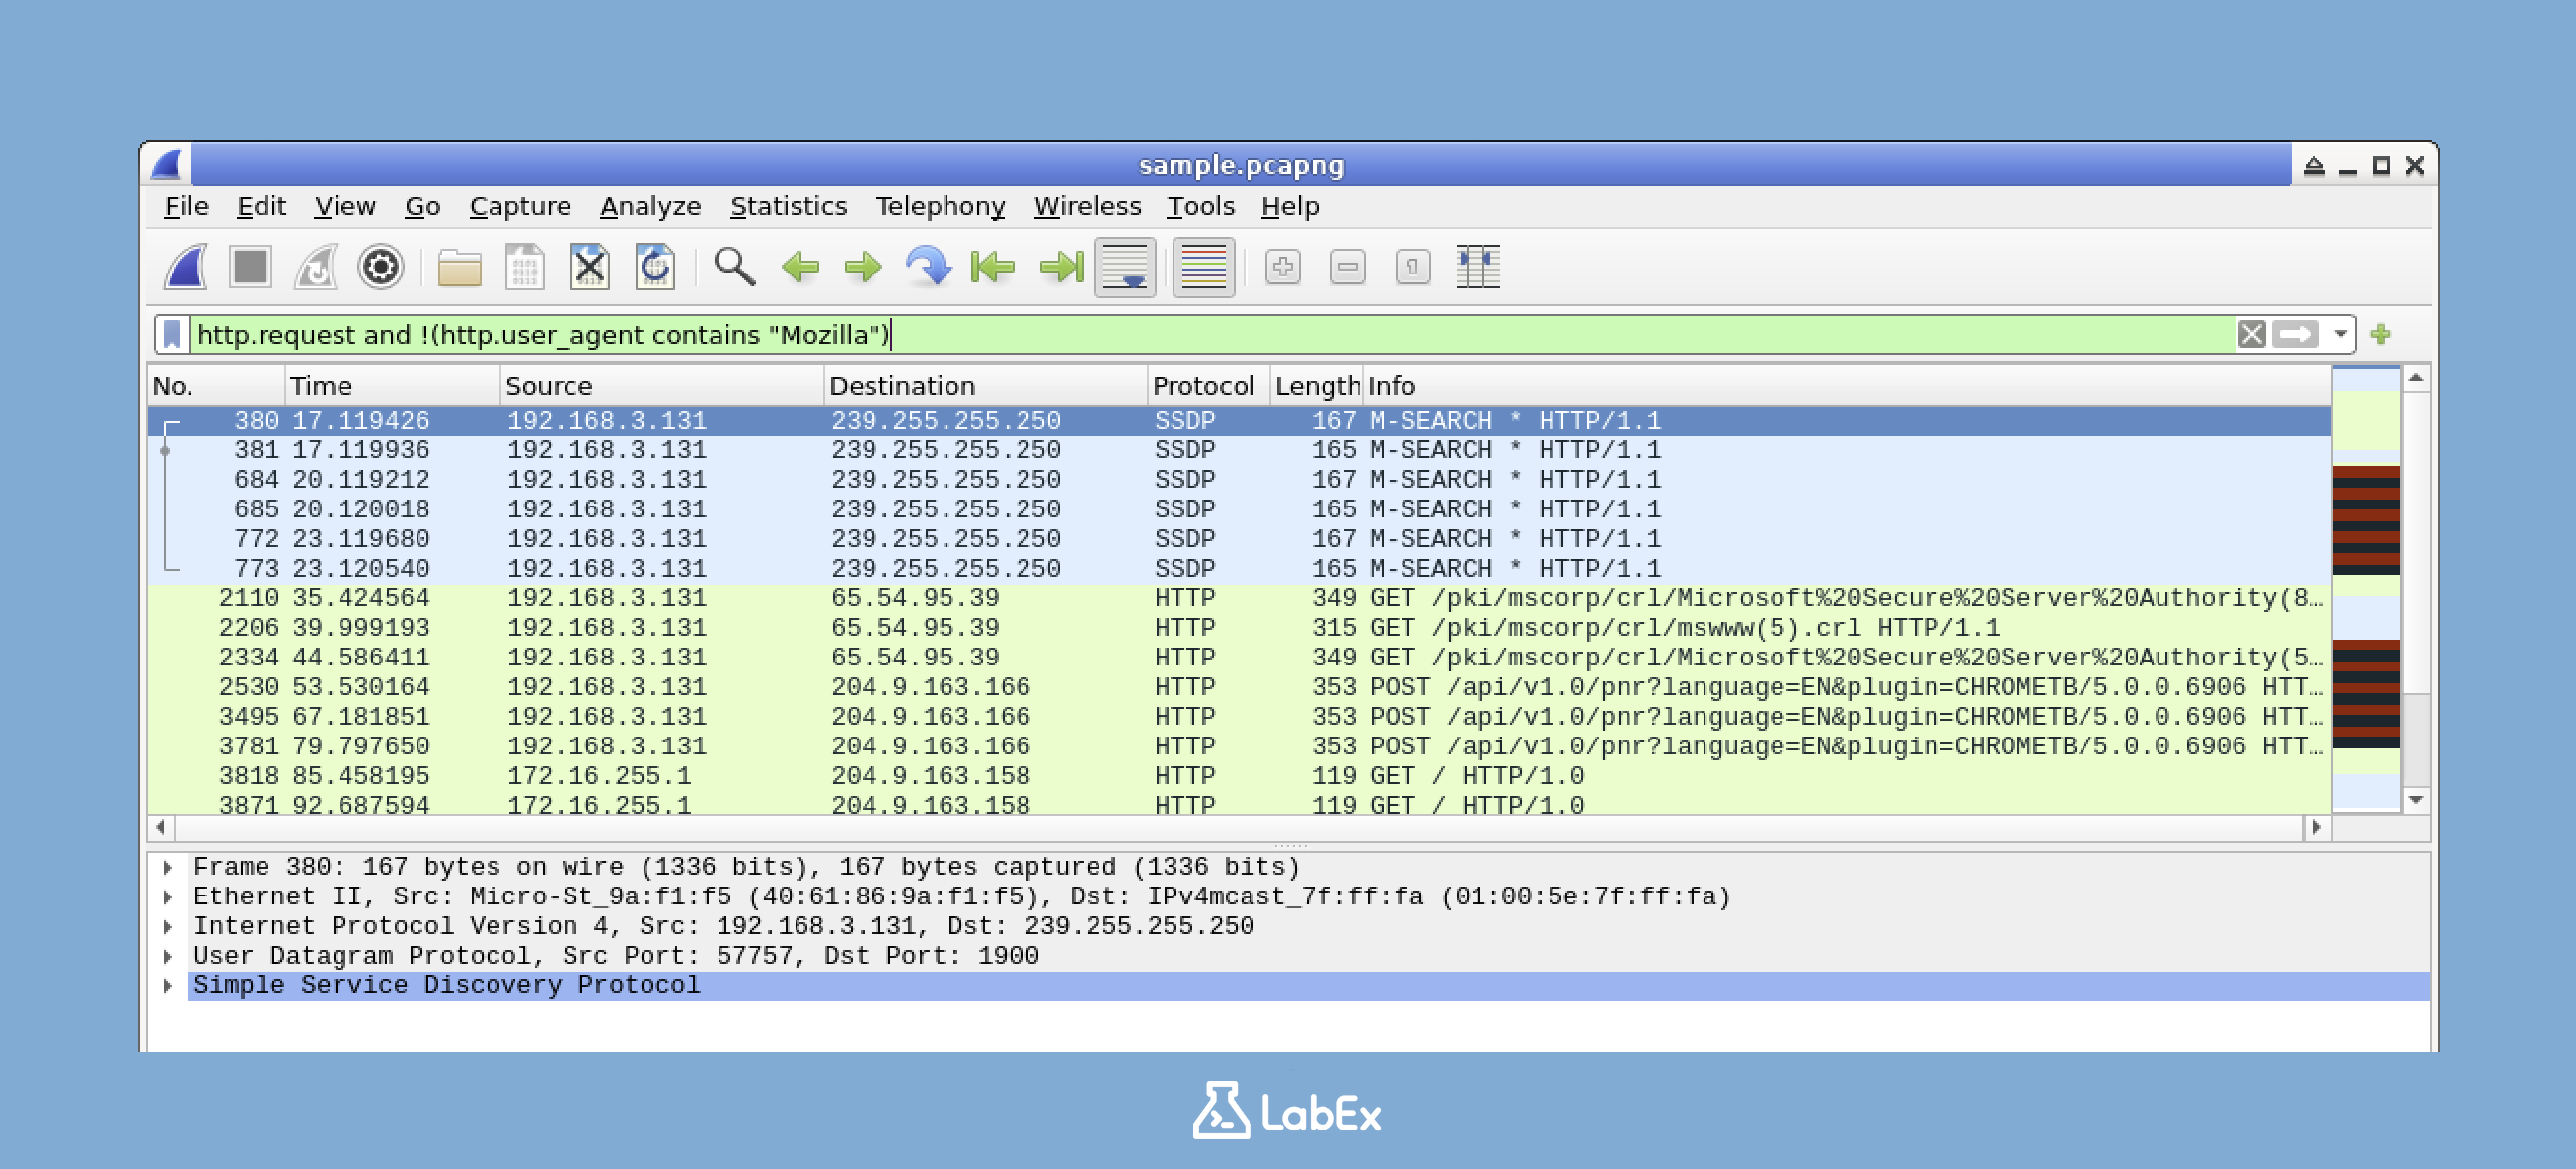
This filter shows HTTP requests that don't have browser user agents. Since most normal web browsing is done using browsers with Mozilla in the user agent, requests without it might indicate automated tools rather than normal browsing.
By practicing these security-focused filtering techniques, you'll develop the skills needed to quickly identify suspicious traffic in real-world network captures.
Conclusion
In this tutorial, you have learned how to use Wireshark display filters for network traffic analysis and potential security threat identification.
You began by either working with a provided sample capture file or capturing live network traffic and familiarizing yourself with the Wireshark interface. Then, you mastered basic display filters to isolate specific traffic types according to protocols, IP addresses, and ports. You also advanced your skills with complex filtering techniques, combining multiple conditions and searching for specific content. Finally, you applied these skills in security analysis scenarios to detect suspicious activities such as port scanning, credential exposure, and potential attacks.
These Wireshark filtering skills are crucial for efficient network troubleshooting and security analysis. By quickly isolating relevant packets from large captures, you can greatly reduce the time required to identify and respond to network issues and security incidents.
As you keep practicing with Wireshark, you will gain an intuitive understanding of network protocols and traffic patterns, enhancing your overall cybersecurity capabilities.
To practice the operations from this tutorial, try the interactive hands-on lab: Analyze Network Traffic with Wireshark Display Filters








![YouTube Announces New Creation Tools for Shorts [Video]](https://www.iclarified.com/images/news/96923/96923/96923-640.jpg)
![Apple Faces New Tariffs but Has Options to Soften the Blow [Kuo]](https://www.iclarified.com/images/news/96921/96921/96921-640.jpg)













.webp?#)




![[The AI Show Episode 142]: ChatGPT’s New Image Generator, Studio Ghibli Craze and Backlash, Gemini 2.5, OpenAI Academy, 4o Updates, Vibe Marketing & xAI Acquires X](https://www.marketingaiinstitute.com/hubfs/ep%20142%20cover.png)















![Is this a suitable approach to architect a flutter app? [closed]](https://i.sstatic.net/4hMHGb1L.png)











![[DEALS] Microsoft Office Professional 2021 for Windows: Lifetime License (75% off) & Other Deals Up To 98% Off – Offers End Soon!](https://www.javacodegeeks.com/wp-content/uploads/2012/12/jcg-logo.jpg)

