


![Nomad Goods Launches 15% Sitewide Sale for 48 Hours Only [Deal]](https://www.iclarified.com/images/news/96899/96899/96899-640.jpg)


![Apple Watch Series 10 Prototype with Mystery Sensor Surfaces [Images]](https://www.iclarified.com/images/news/96892/96892/96892-640.jpg)


![[The AI Show Episode 142]: ChatGPT’s New Image Generator, Studio Ghibli Craze and Backlash, Gemini 2.5, OpenAI Academy, 4o Updates, Vibe Marketing & xAI Acquires X](https://www.marketingaiinstitute.com/hubfs/ep%20142%20cover.png)


![Is this a suitable approach to architect a flutter app? [closed]](https://i.sstatic.net/4hMHGb1L.png)


![From broke musician to working dev. How college drop-out Ryan Furrer taught himself to code [Podcast #166]](https://cdn.hashnode.com/res/hashnode/image/upload/v1743189826063/2080cde4-6fc0-46fb-b98d-b3d59841e8c4.png?#)


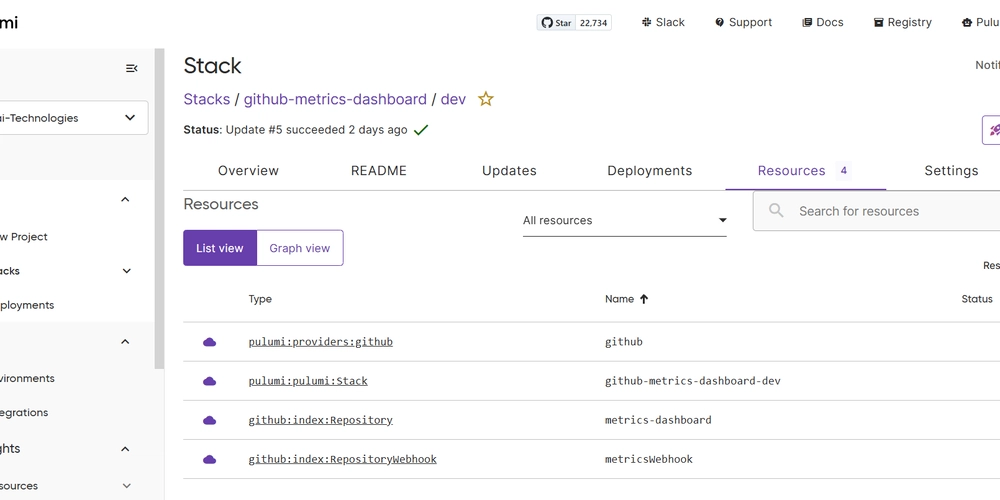
GitHub Metrics Dashboard (Pulumi & Grafana)
This is a submission for the Pulumi Deploy and Document Challenge: Get Creative with Pulumi and GitHub What I Built This project is a GitHub Metrics Dashboard, built for the Get Creative with Pulumi and GitHub Challenge. It automates GitHub analytics visualization using Pulumi, GitHub Webhooks, and Grafana. The system collects GitHub repository events, processes them, and displays them in a Grafana dashboard for real-time insights. Live Demo Link Project Repo https://github.com/Adonai-Technologies/GitHub-Metrics-Dashboard-Pulumi-Grafana-.git GitHub Metrics Dashboard (Pulumi & Grafana) Features Automated GitHub Metrics Collection – Uses webhooks to track repository activity. Pulumi Infrastructure as Code (IaC) – Deploys and configures cloud resources. Grafana Visualization – Presents GitHub analytics with rich dashboards. Scalable and Flexible – Supports multiple repositories and event types. Tech Stack Pulumi (Infrastructure as Code) GitHub Webhooks (Event Processing) Node.js & TypeScript (Webhook Receiver) Grafana (Metrics Visualization) Cloudflare Tunnel (Webhook Exposure) Setup Guide 1️⃣ Clone the Repository git clone https://github.com/yourusername/github-metrics-dashboard.git cd github-metrics-dashboard 2️⃣ Install Dependencies npm install 3️⃣ Set Up Webhook Receiver cd webhook-receiver npm install node index.js If successful, you should see: Webhook receiver running on port 4000 4️⃣ Expose Webhook Receiver cloudflared tunnel --url http://localhost:4000 This generates a public URL, e.g.: https://your-tunnel.trycloudflare.com 5️⃣ Configure GitHub Webhook Go to your GitHub repository. Navigate to Settings > Webhooks. Click Add Webhook. Set the Payload URL to https://your-tunnel.trycloudflare.com/github-webhook. Choose application/json as the content type. Select the events (push, pull request, issues, etc.). Click Add Webhook. 6️⃣ Deploy to Cloud with Pulumi Ensure you have Pulumi installed and configured. pulumi up 7️⃣ Access Grafana Dashboard Once Pulumi provisions Grafana, access it via the provided URL and configure data sources. Contribution Contributions are welcome! Feel free to submit issues and pull requests. License MIT License. See LICENSE for details.
This is a submission for the Pulumi Deploy and Document Challenge: Get Creative with Pulumi and GitHub
What I Built
This project is a GitHub Metrics Dashboard, built for the Get Creative with Pulumi and GitHub Challenge. It automates GitHub analytics visualization using Pulumi, GitHub Webhooks, and Grafana. The system collects GitHub repository events, processes them, and displays them in a Grafana dashboard for real-time insights.
Live Demo Link
Project Repo
https://github.com/Adonai-Technologies/GitHub-Metrics-Dashboard-Pulumi-Grafana-.git
GitHub Metrics Dashboard (Pulumi & Grafana)
Features
- Automated GitHub Metrics Collection – Uses webhooks to track repository activity.
- Pulumi Infrastructure as Code (IaC) – Deploys and configures cloud resources.
- Grafana Visualization – Presents GitHub analytics with rich dashboards.
- Scalable and Flexible – Supports multiple repositories and event types.
Tech Stack
- Pulumi (Infrastructure as Code)
- GitHub Webhooks (Event Processing)
- Node.js & TypeScript (Webhook Receiver)
- Grafana (Metrics Visualization)
- Cloudflare Tunnel (Webhook Exposure)
Setup Guide
1️⃣ Clone the Repository
git clone https://github.com/yourusername/github-metrics-dashboard.git
cd github-metrics-dashboard
2️⃣ Install Dependencies
npm install
3️⃣ Set Up Webhook Receiver
cd webhook-receiver
npm install
node index.js
If successful, you should see:
Webhook receiver running on port 4000
4️⃣ Expose Webhook Receiver
cloudflared tunnel --url http://localhost:4000
This generates a public URL, e.g.:
https://your-tunnel.trycloudflare.com
5️⃣ Configure GitHub Webhook
- Go to your GitHub repository.
- Navigate to Settings > Webhooks.
- Click Add Webhook.
- Set the Payload URL to
https://your-tunnel.trycloudflare.com/github-webhook. - Choose application/json as the content type.
- Select the events (push, pull request, issues, etc.).
- Click Add Webhook.
6️⃣ Deploy to Cloud with Pulumi
Ensure you have Pulumi installed and configured.
pulumi up
7️⃣ Access Grafana Dashboard
Once Pulumi provisions Grafana, access it via the provided URL and configure data sources.
Contribution
Contributions are welcome! Feel free to submit issues and pull requests.
License
MIT License. See LICENSE for details.