


![Nomad Goods Launches 15% Sitewide Sale for 48 Hours Only [Deal]](https://www.iclarified.com/images/news/96899/96899/96899-640.jpg)


![Apple Watch Series 10 Prototype with Mystery Sensor Surfaces [Images]](https://www.iclarified.com/images/news/96892/96892/96892-640.jpg)


![[The AI Show Episode 142]: ChatGPT’s New Image Generator, Studio Ghibli Craze and Backlash, Gemini 2.5, OpenAI Academy, 4o Updates, Vibe Marketing & xAI Acquires X](https://www.marketingaiinstitute.com/hubfs/ep%20142%20cover.png)


![Is this a suitable approach to architect a flutter app? [closed]](https://i.sstatic.net/4hMHGb1L.png)


![From broke musician to working dev. How college drop-out Ryan Furrer taught himself to code [Podcast #166]](https://cdn.hashnode.com/res/hashnode/image/upload/v1743189826063/2080cde4-6fc0-46fb-b98d-b3d59841e8c4.png?#)


The Principle Analysis of Frontend Monitoring SDK
A complete frontend monitoring platform consists of three parts: data collection and reporting, data processing and storage, and data visualization. This article focuses on the first component - data collection and reporting. Below is an outline of the topics we'll cover: Since theoretical knowledge alone can be difficult to grasp, I've created a simple monitoring SDK that implements these technical concepts. You can use it to create simple demos and gain a better understanding. Reading this article while experimenting with the SDK will provide the best learning experience. Collect Performance Data The Chrome developer team has proposed a series of metrics to monitor page performance: FP (First Paint) - Time from when the page starts loading until the first pixel is painted on the screen (essentially the white screen time) FCP (First Contentful Paint) - Time from page load start until any part of page content is rendered LCP (Largest Contentful Paint) - Time from page load start until the largest text block or image element completes rendering CLS (Cumulative Layout Shift) - Cumulative score of all unexpected layout shifts occurring between page load start and when the page's lifecycle state becomes hidden We can obtain these four performance metrics through PerformanceObserver (they can also be retrieved via performance.getEntriesByName(), but this method doesn't provide real-time notifications when events occur). PerformanceObserver is a performance monitoring interface used to observe performance measurement events. FP Implementation code: const entryHandler = (list) => { for (const entry of list.getEntries()) { if (entry.name === 'first-paint') { observer.disconnect() } console.log(entry) } } const observer = new PerformanceObserver(entryHandler) // The buffered property indicates whether to observe cached data, // allowing observation even if the monitoring code is added after the event occurs observer.observe({ type: 'paint', buffered: true }) The FP measurement output: { duration: 0, entryType: "paint", name: "first-paint", startTime: 359, // FP time } The startTime value represents the paint timing we need. FCP FCP (First Contentful Paint) - Time from page load start until any part of page content is rendered. The "content" in this metric refers to text, images (including background images), elements, and non-white elements. To provide a good user experience, the FCP score should be kept under 1.8 seconds. The measurement code: const entryHandler = (list) => { for (const entry of list.getEntries()) { if (entry.name === 'first-contentful-paint') { observer.disconnect() } console.log(entry) } } const observer = new PerformanceObserver(entryHandler) observer.observe({ type: 'paint', buffered: true }) We can get the value of FCP via the above code: { duration: 0, entryType: "paint", name: "first-contentful-paint", startTime: 459, // fcp 时间 } The startTime value is the painting time we need. LCP LCP (Largest Contentful Paint) - Time from page load start until the largest text block or image element completes rendering. The LCP metric reports the relative render time of the largest visible image or text block in the viewport, measured from when the page first begins loading. A good LCP score should be kept under 2.5 seconds. The measurement code: const entryHandler = (list) => { if (observer) { observer.disconnect() } for (const entry of list.getEntries()) { console.log(entry) } } const observer = new PerformanceObserver(entryHandler) observer.observe({ type: 'largest-contentful-paint', buffered: true }) We can get the value of LCP via the above code: { duration: 0, element: p, entryType: "largest-contentful-paint", id: "", loadTime: 0, name: "", renderTime: 1021.299, size: 37932, startTime: 1021.299, url: "", } The startTime value is the painting time we need. And element refers to the element being painted during LCP. The difference between FCP and LCP is: FCP event occurs when any content is painted, while LCP event occurs when the largest content finishes rendering. LCP considers these elements: elements elements inside elements (using poster images) Elements with background images loaded via the url() function (not using CSS gradients) Block-level elements containing text nodes or other inline-level text elements CLS CLS (Cumulative Layout Shift) - Cumulative score of all unexpected layout shifts occurring between page load start and when the page's lifecycle state becomes hidden. The layout shift score is calculated as follows: layout shift score = impact score × distance score The impact score measures how unstable elements af
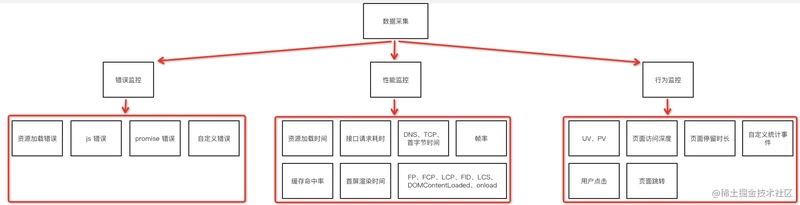
A complete frontend monitoring platform consists of three parts: data collection and reporting, data processing and storage, and data visualization.
This article focuses on the first component - data collection and reporting. Below is an outline of the topics we'll cover:
Since theoretical knowledge alone can be difficult to grasp, I've created a simple monitoring SDK that implements these technical concepts. You can use it to create simple demos and gain a better understanding. Reading this article while experimenting with the SDK will provide the best learning experience.
Collect Performance Data
The Chrome developer team has proposed a series of metrics to monitor page performance:
- FP (First Paint) - Time from when the page starts loading until the first pixel is painted on the screen (essentially the white screen time)
- FCP (First Contentful Paint) - Time from page load start until any part of page content is rendered
- LCP (Largest Contentful Paint) - Time from page load start until the largest text block or image element completes rendering
- CLS (Cumulative Layout Shift) - Cumulative score of all unexpected layout shifts occurring between page load start and when the page's lifecycle state becomes hidden
We can obtain these four performance metrics through PerformanceObserver (they can also be retrieved via performance.getEntriesByName(), but this method doesn't provide real-time notifications when events occur). PerformanceObserver is a performance monitoring interface used to observe performance measurement events.
FP
Implementation code:
const entryHandler = (list) => {
    for (const entry of list.getEntries()) {
        if (entry.name === 'first-paint') {
            observer.disconnect()
        }
        console.log(entry)
    }
}

const observer = new PerformanceObserver(entryHandler)
// The buffered property indicates whether to observe cached data,
// allowing observation even if the monitoring code is added after the event occurs
observer.observe({ type: 'paint', buffered: true })
The FP measurement output:
{
    duration: 0,
    entryType: "paint",
    name: "first-paint",
    startTime: 359, // FP time
}
The startTime value represents the paint timing we need.
FCP
FCP (First Contentful Paint) - Time from page load start until any part of page content is rendered. The "content" in this metric refers to text, images (including background images), elements, and non-white elements.

To provide a good user experience, the FCP score should be kept under 1.8 seconds.

The measurement code:
const entryHandler = (list) => {
    for (const entry of list.getEntries()) {
        if (entry.name === 'first-contentful-paint') {
            observer.disconnect()
        }

        console.log(entry)
    }
}

const observer = new PerformanceObserver(entryHandler)
observer.observe({ type: 'paint', buffered: true })
We can get the value of FCP via the above code:
{
    duration: 0,
    entryType: "paint",
    name: "first-contentful-paint",
    startTime: 459, // fcp 时间
}
The startTime value is the painting time we need.
LCP
LCP (Largest Contentful Paint) - Time from page load start until the largest text block or image element completes rendering. The LCP metric reports the relative render time of the largest visible image or text block in the viewport, measured from when the page first begins loading.
A good LCP score should be kept under 2.5 seconds.

The measurement code:
const entryHandler = (list) => {
    if (observer) {
        observer.disconnect()
    }

    for (const entry of list.getEntries()) {
        console.log(entry)
    }
}

const observer = new PerformanceObserver(entryHandler)
observer.observe({ type: 'largest-contentful-paint', buffered: true })
We can get the value of LCP via the above code:
{
    duration: 0,
    element: p,
    entryType: "largest-contentful-paint",
    id: "",
    loadTime: 0,
    name: "",
    renderTime: 1021.299,
    size: 37932,
    startTime: 1021.299,
    url: "",
}
The startTime value is the painting time we need. And element refers to the element being painted during LCP.
The difference between FCP and LCP is: FCP event occurs when any content is painted, while LCP event occurs when the largest content finishes rendering.

LCP considers these elements:
-
-
-
elements (using poster images) - Elements with background images loaded via the
url()function (not using CSS gradients) - Block-level elements containing text nodes or other inline-level text elements
CLS
CLS (Cumulative Layout Shift) - Cumulative score of all unexpected layout shifts occurring between page load start and when the page's lifecycle state becomes hidden.
The layout shift score is calculated as follows:
layout shift score = impact score × distance score
The impact score measures how unstable elements affect the visible area between two frames. The distance score is calculated by taking the greatest distance any unstable element has moved (either horizontally or vertically) and dividing it by the viewport's largest dimension (width or height, whichever is greater).
CLS is the sum of all layout shift scores.
A layout shift occurs when a DOM element changes position between two rendered frames, as shown below:


In the above diagram, the rectangle moves from the top-left to the right side, counting as one layout shift. In CLS terminology, there's a concept called "session window": one or more individual layout shifts occurring in rapid succession, with less than 1 second between each shift and a maximum window duration of 5 seconds.

For example, in the second session window shown above, there are four layout shifts. Each shift must occur less than 1 second after the previous one, and the time between the first and last shifts must not exceed 5 seconds to qualify as a session window. If these conditions aren't met, it's considered a new session window. This specification comes from extensive experimentation and research by the Chrome team, as detailed in Evolving the CLS metric.
CLS has three calculation methods:
- Cumulative
- Average of all session windows
- Maximum of all session windows
Cumulative
This method adds up all layout shift scores from page load start. However, this approach disadvantages long-lived pages - the longer a page is open, the higher the CLS score becomes.
Average of All Session Windows
This method calculates based on session windows rather than individual layout shifts, taking the average of all session window scores. However, this approach has limitations.

As shown above, if the first session window has a high CLS score and the second has a low score, averaging them masks the actual page behavior. The average doesn't reflect that the page had more shifts early on and fewer later.
Maximum of All Session Windows
This is currently the optimal calculation method, using the highest session window score to reflect the worst-case scenario for layout shifts. For more details, see Evolving the CLS metric.
Below is the implementation code for the third calculation method:
let sessionValue = 0
let sessionEntries = []
const cls = {
    subType: 'layout-shift',
    name: 'layout-shift',
    type: 'performance',
    pageURL: getPageURL(),
    value: 0,
}

const entryHandler = (list) => {
    for (const entry of list.getEntries()) {
        // Only count layout shifts without recent user input.
        if (!entry.hadRecentInput) {
            const firstSessionEntry = sessionEntries[0]
            const lastSessionEntry = sessionEntries[sessionEntries.length - 1]

            // If the entry occurred less than 1 second after the previous entry and
            // less than 5 seconds after the first entry in the session, include the
            // entry in the current session. Otherwise, start a new session.
            if (
                sessionValue
                && entry.startTime - lastSessionEntry.startTime < 1000
                && entry.startTime - firstSessionEntry.startTime < 5000
            ) {
                sessionValue += entry.value
                sessionEntries.push(formatCLSEntry(entry))
            } else {
                sessionValue = entry.value
                sessionEntries = [formatCLSEntry(entry)]
            }

            // If the current session value is larger than the current CLS value,
            // update CLS and the entries contributing to it.
            if (sessionValue > cls.value) {
                cls.value = sessionValue
                cls.entries = sessionEntries
                cls.startTime = performance.now()
                lazyReportCache(deepCopy(cls))
            }
        }
    }
}

const observer = new PerformanceObserver(entryHandler)
observer.observe({ type: 'layout-shift', buffered: true })
A single layout shift measurement contains the following data:
{
  duration: 0,
  entryType: "layout-shift",
  hadRecentInput: false,
  lastInputTime: 0,
  name: "",
  sources: (2) [LayoutShiftAttribution, LayoutShiftAttribution],
  startTime: 1176.199999999255,
  value: 0.000005752046026677329,
}
The value field represents the layout shift score.
DOMContentLoaded and Load Events
The DOMContentLoaded event is triggered when the HTML is fully loaded and parsed, without waiting for CSS, images, and iframes to load.
The load event is triggered when the entire page and all dependent resources such as stylesheets and images have finished loading.
Although these performance metrics are older, they still provide valuable insights into page behavior. Monitoring them remains necessary.
import { lazyReportCache } from '../utils/report'

['load', 'DOMContentLoaded'].forEach(type => onEvent(type))

function onEvent(type) {
    function callback() {
        lazyReportCache({
            type: 'performance',
            subType: type.toLocaleLowerCase(),
            startTime: performance.now(),
        })

        window.removeEventListener(type, callback, true)
    }

    window.addEventListener(type, callback, true)
}
First Screen Rendering Time
In most cases, the first screen rendering time can be obtained through the load event. However, there are exceptions, such as asynchronously loaded images and DOM elements.
In such cases, we cannot obtain the first screen rendering time through the load event. Instead, we need to use MutationObserver to get the first screen rendering time. MutationObserver triggers events when the properties of the DOM elements it's monitoring change.
The process of calculating first screen rendering time:
- Use MutationObserver to monitor the document object, triggering events whenever DOM element properties change.
- Check if the DOM element is in the first screen. If it is, call
performance.now()in therequestAnimationFrame()callback function to get the current time as its rendering time. - Compare the rendering time of the last DOM element with the loading time of all images in the first screen, and use the maximum value as the first screen rendering time.
Monitoring DOM
const next = window.requestAnimationFrame ? requestAnimationFrame : setTimeout
const ignoreDOMList = ['STYLE', 'SCRIPT', 'LINK']

observer = new MutationObserver(mutationList => {
    const entry = {
        children: [],
    }

    for (const mutation of mutationList) {
        if (mutation.addedNodes.length && isInScreen(mutation.target)) {
             // ...
        }
    }

    if (entry.children.length) {
        entries.push(entry)
        next(() => {
            entry.startTime = performance.now()
        })
    }
})

observer.observe(document, {
    childList: true,
    subtree: true,
})
The code above monitors DOM changes while filtering out style, script, and link tags.
Checking if Element is in First Screen
A page may have a lot of content, but users can only see one screen at a time. Therefore, when calculating first screen rendering time, we need to limit the scope to content visible in the current screen.
const viewportWidth = window.innerWidth
const viewportHeight = window.innerHeight

// Check if DOM element is in screen
function isInScreen(dom) {
    const rectInfo = dom.getBoundingClientRect()
    if (
        rectInfo.left >= 0
        && rectInfo.left < viewportWidth
        && rectInfo.top >= 0
        && rectInfo.top < viewportHeight
    ) {
        return true
    }
}
Using requestAnimationFrame() to Get DOM Rendering Time
When DOM changes trigger the MutationObserver event, it only means the DOM content can be read, not that it has been painted to the screen.

As shown in the image above, when the MutationObserver event is triggered, we can read that document.body already has content, but the left side of the screen hasn't painted anything yet. Therefore, we need to call requestAnimationFrame() to get the current time as the DOM rendering time after the browser has successfully painted.
Comparing with All Image Loading Times in First Screen
function getRenderTime() {
    let startTime = 0
    entries.forEach(entry => {
        if (entry.startTime > startTime) {
            startTime = entry.startTime
        }
    })

    // Need to compare with all image loading times in current page, take the maximum
    // Image request time must be less than startTime, response end time must be greater than startTime
    performance.getEntriesByType('resource').forEach(item => {
        if (
            item.initiatorType === 'img'
            && item.fetchStart < startTime
            && item.responseEnd > startTime
        ) {
            startTime = item.responseEnd
        }
    })

    return startTime
}
Optimization
The current code still needs optimization, with two main points to consider:
- When should we report the rendering time?
- How to handle asynchronously added DOM elements?
For the first point, we must report the rendering time after DOM changes stop, which typically happens after the load event triggers. Therefore, we can report at this point.
For the second point, we can report after the LCP event triggers. Whether DOM elements are loaded synchronously or asynchronously, they need to be painted, so we can monitor the LCP event and only allow reporting after it triggers.
Combining these two approaches, we get the following code:
let isOnLoaded = false
executeAfterLoad(() => {
isOnLoaded = true
})
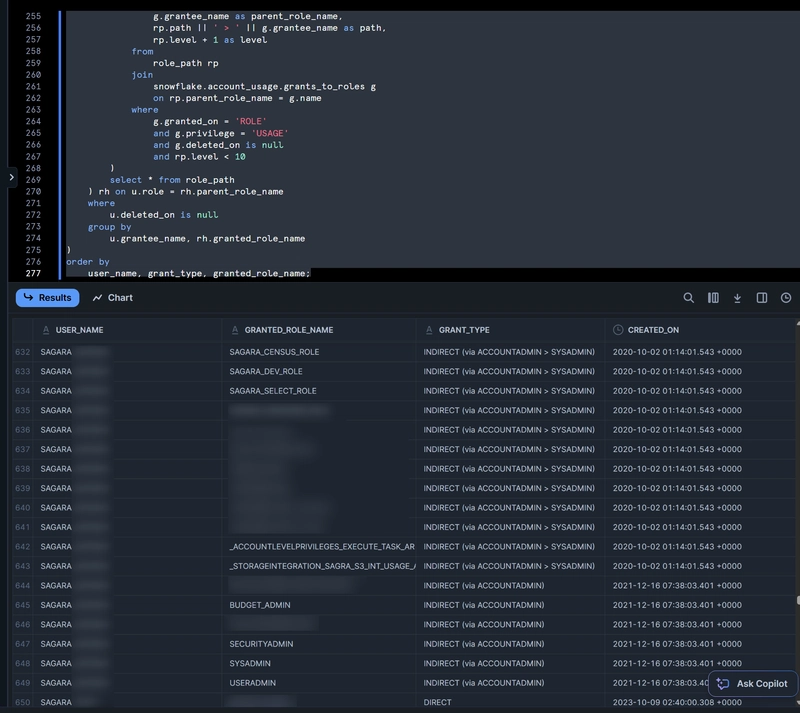
let timer
let observer
function checkDOMChange() {
clearTimeout(timer)
timer = setTimeout(() => {
// Calculate first screen rendering time after load and LCP events trigger and DOM tree stops changing
if (isOnLoaded && isLCPDone()) {
observer && observer.disconnect()
lazyReportCache({
type: 'performance',
subType: 'first-screen-paint',
startTime: getRenderTime(),
pageURL: getPageURL(),
})
entries = null
} else {
checkDOMChange()
}
}, 500)
}
The checkDOMChange() function is called each time the MutationObserver event triggers and needs to be debounced.
API Request Timing
To monitor API request timing, we need to intercept both XMLHttpRequest and fetch requests.
Monitoring XMLHttpRequest
originalProto.open = function newOpen(...args) {
    this.url = args[1]
    this.method = args[0]
    originalOpen.apply(this, args)
}

originalProto.send = function newSend(...args) {
    this.startTime = Date.now()

    const onLoadend = () => {
        this.endTime = Date.now()
        this.duration = this.endTime - this.startTime

        const { status, duration, startTime, endTime, url, method } = this
        const reportData = {
            status,
            duration,
            startTime,
            endTime,
            url,
            method: (method || 'GET').toUpperCase(),
            success: status >= 200 && status < 300,
            subType: 'xhr',
            type: 'performance',
        }

        lazyReportCache(reportData)

        this.removeEventListener('loadend', onLoadend, true)
    }

    this.addEventListener('loadend', onLoadend, true)
    originalSend.apply(this, args)
}
To determine if an XML request is successful, we can check if its status code is between 200 and 299. If it is, the request was successful; otherwise, it failed.
Monitoring fetch
const originalFetch = window.fetch

function overwriteFetch() {
    window.fetch = function newFetch(url, config) {
        const startTime = Date.now()
        const reportData = {
            startTime,
            url,
            method: (config?.method || 'GET').toUpperCase(),
            subType: 'fetch',
            type: 'performance',
        }

        return originalFetch(url, config)
        .then(res => {
            reportData.endTime = Date.now()
            reportData.duration = reportData.endTime - reportData.startTime

            const data = res.clone()
            reportData.status = data.status
            reportData.success = data.ok

            lazyReportCache(reportData)

            return res
        })
        .catch(err => {
            reportData.endTime = Date.now()
            reportData.duration = reportData.endTime - reportData.startTime
            reportData.status = 0
            reportData.success = false

            lazyReportCache(reportData)

            throw err
        })
    }
}
For fetch requests, we can determine success by checking the ok field in the response data. If it's true, the request was successful; otherwise, it failed.
Note: The API request timing we monitor may differ from what's shown in Chrome DevTools. This is because Chrome DevTools shows the time for the entire HTTP request and interface process. However, XHR and fetch are asynchronous requests - after the interface request succeeds, the callback function needs to be called. When the event triggers, the callback function is placed in the message queue, and then the browser processes it. There's also a waiting period in between.
Resource Loading Time and Cache Hit Rate
We can monitor resource and navigation events through PerformanceObserver. If the browser doesn't support PerformanceObserver, we can fall back to using performance.getEntriesByType(entryType).
When the resource event triggers, we can get the corresponding resource list. Each resource object contains the following fields:

From these fields, we can extract useful information:
{
    name: entry.name, // Resource name
    subType: entryType,
    type: 'performance',
    sourceType: entry.initiatorType, // Resource type
    duration: entry.duration, // Resource loading duration
    dns: entry.domainLookupEnd - entry.domainLookupStart, // DNS duration
    tcp: entry.connectEnd - entry.connectStart, // TCP connection duration
    redirect: entry.redirectEnd - entry.redirectStart, // Redirect duration
    ttfb: entry.responseStart, // Time to first byte
    protocol: entry.nextHopProtocol, // Request protocol
    responseBodySize: entry.encodedBodySize, // Response body size
    responseHeaderSize: entry.transferSize - entry.encodedBodySize, // Response header size
    resourceSize: entry.decodedBodySize, // Resource size after decompression
    isCache: isCache(entry), // Whether cache was hit
    startTime: performance.now(),
}
Determining if Resource Hit Cache
Among these resource objects, there's a transferSize field that represents the size of the resource being fetched, including response header fields and response data size. If this value is 0, it means the resource was read directly from cache (forced cache). If this value is not 0 but the encodedBodySize field is 0, it means it used negotiated cache (encodedBodySize represents the size of the response data body).
function isCache(entry) {
    // Read directly from cache or 304
    return entry.transferSize === 0 || (entry.transferSize !== 0 && entry.encodedBodySize === 0)
}
If it doesn't meet the above conditions, it means the cache was not hit. Then we can calculate the cache hit rate by dividing all cached data/total data.
Browser Back/Forward Cache (BFC)
BFC is a memory cache that saves the entire page in memory. When users navigate back, they can see the entire page immediately without refreshing. According to the article bfcache, Firefox and Safari have always supported BFC, while Chrome only supports it in high-version mobile browsers. However, when I tested it, only Safari supported it - my Firefox version might have been different.
However, BFC also has drawbacks. When users navigate back and restore the page from BFC, the original page's code won't execute again. For this reason, browsers provide a pageshow event where we can put code that needs to be executed again.
window.addEventListener('pageshow', function(event) {
  // If this property is true, it means the page was restored from BFC
  if (event.persisted) {
    console.log('This page was restored from the bfcache.');
  } else {
    console.log('This page was loaded normally.');
  }
});
For pages restored from BFC, we also need to collect their FP, FCP, LCP, and other timing metrics.
onBFCacheRestore(event => {
    requestAnimationFrame(() => {
        ['first-paint', 'first-contentful-paint'].forEach(type => {
            lazyReportCache({
                startTime: performance.now() - event.timeStamp,
                name: type,
                subType: type,
                type: 'performance',
                pageURL: getPageURL(),
                bfc: true,
            })
        })
    })
})
The code above is easy to understand. After the pageshow event triggers, we subtract the event timestamp from the current time - this time difference is the rendering time of the performance metrics. Note: For pages restored from BFC, these performance metrics usually have very small values, around 10 ms. Therefore, we need to add an identifier field bfc: true so we can ignore them when doing performance statistics.
FPS
We can calculate the current page's FPS using requestAnimationFrame().
const next = window.requestAnimationFrame
    ? requestAnimationFrame : (callback) => { setTimeout(callback, 1000 / 60) }

const frames = []

export default function fps() {
    let frame = 0
    let lastSecond = Date.now()

    function calculateFPS() {
        frame++
        const now = Date.now()
        if (lastSecond + 1000 <= now) {
            // Since now - lastSecond is in milliseconds, frame needs to be multiplied by 1000
            const fps = Math.round((frame * 1000) / (now - lastSecond))
            frames.push(fps)

            frame = 0
            lastSecond = now
        }

        // Avoid reporting too frequently, cache a certain amount before reporting
        if (frames.length >= 60) {
            report(deepCopy({
                frames,
                type: 'performace',
                subType: 'fps',
            }))

            frames.length = 0
        }

        next(calculateFPS)
    }

    calculateFPS()
}
The code logic is as follows:
- First record an initial time, then each time
requestAnimationFrame()triggers, increment the frame count by 1. After one second passes, we can get the current frame rate by dividingframe count/elapsed time.
When three consecutive FPS values below 20 appear, we can determine that the page has become unresponsive. For more details, see How to Monitor Page Stuttering.
export function isBlocking(fpsList, below = 20, last = 3) {
    let count = 0
    for (let i = 0; i < fpsList.length; i++) {
        if (fpsList[i] && fpsList[i] < below) {
            count++
        } else {
            count = 0
        }

        if (count >= last) {
            return true
        }
    }

    return false
}
Vue Router Change Rendering Time
We already know how to calculate first screen rendering time, but how do we calculate the page rendering time caused by route changes in SPA applications? This article uses Vue as an example to explain my approach.
export default function onVueRouter(Vue, router) {
    let isFirst = true
    let startTime
    router.beforeEach((to, from, next) => {
        // First page load already has other rendering time metrics available
        if (isFirst) {
            isFirst = false
            return next()
        }

        // Add a new field to router to indicate whether to calculate rendering time
        // Only needed for route changes
        router.needCalculateRenderTime = true
        startTime = performance.now()

        next()
    })

    let timer
    Vue.mixin({
        mounted() {
            if (!router.needCalculateRenderTime) return

            this.$nextTick(() => {
                // Code that only runs after the entire view has been rendered
                const now = performance.now()
                clearTimeout(timer)

                timer = setTimeout(() => {
                    router.needCalculateRenderTime = false
                    lazyReportCache({
                        type: 'performance',
                        subType: 'vue-router-change-paint',
                        duration: now - startTime,
                        startTime: now,
                        pageURL: getPageURL(),
                    })
                }, 1000)
            })
        },
    })
}
The code logic is as follows:
- Monitor route hooks - when route changes occur, the
router.beforeEach()hook triggers. In this hook's callback function, record the current time as the rendering start time. - Use
Vue.mixin()to inject a function into all components'mounted()hooks. Each function executes a debounced function. - When the last component's
mounted()triggers, it means all components under this route have been mounted. We can get the rendering time in thethis.$nextTick()callback function.
Additionally, we need to consider another case. When not changing routes, there may also be component changes, in which case we shouldn't calculate rendering time in these components' mounted() hooks. Therefore, we need to add a needCalculateRenderTime field - set it to true when changing routes to indicate that rendering time can be calculated.
Error Data Collection
Resource Loading Errors
Using addEventListener() to monitor the error event can capture resource loading failure errors.
// Capture resource loading failure errors js css img...
window.addEventListener('error', e => {
    const target = e.target
    if (!target) return

    if (target.src || target.href) {
        const url = target.src || target.href
        lazyReportCache({
            url,
            type: 'error',
            subType: 'resource',
            startTime: e.timeStamp,
            html: target.outerHTML,
            resourceType: target.tagName,
            paths: e.path.map(item => item.tagName).filter(Boolean),
            pageURL: getPageURL(),
        })
    }
}, true)
JavaScript Errors
Using window.onerror can monitor JavaScript errors.
// Monitor JavaScript errors
window.onerror = (msg, url, line, column, error) => {
    lazyReportCache({
        msg,
        line,
        column,
        error: error.stack,
        subType: 'js',
        pageURL: url,
        type: 'error',
        startTime: performance.now(),
    })
}
Promise Errors
Using addEventListener() to monitor the unhandledrejection event can capture unhandled promise errors.
// Monitor promise errors - drawback is can't get column data
window.addEventListener('unhandledrejection', e => {
    lazyReportCache({
        reason: e.reason?.stack,
        subType: 'promise',
        type: 'error',
        startTime: e.timeStamp,
        pageURL: getPageURL(),
    })
})
Sourcemap
Generally, production environment code is minified, and sourcemap files are not uploaded to production. Therefore, error messages in production environment code are difficult to read. For this reason, we can use source-map to restore these minified code error messages.
When code errors occur, we can get the corresponding filename, line number, and column number:
{
    line: 1,
    column: 17,
    file: 'https:/www.xxx.com/bundlejs',
}
Then call the following code to restore:
async function parse(error) {
    const mapObj = JSON.parse(getMapFileContent(error.url))
    const consumer = await new sourceMap.SourceMapConsumer(mapObj)
    // Remove ./ from webpack://source-map-demo/./src/index.js file
    const sources = mapObj.sources.map(item => format(item))
    // Get original line and column numbers and source file based on minified error information
    const originalInfo = consumer.originalPositionFor({ line: error.line, column: error.column })
    // sourcesContent contains the original source code of each file before minification, find corresponding source code by filename
    const originalFileContent = mapObj.sourcesContent[sources.indexOf(originalInfo.source)]
    return {
        file: originalInfo.source,
        content: originalFileContent,
        line: originalInfo.line,
        column: originalInfo.column,
        msg: error.msg,
        error: error.error
    }
}

function format(item) {
    return item.replace(/(\.\/)*/g, '')
}

function getMapFileContent(url) {
    return fs.readFileSync(path.resolve(__dirname, `./maps/${url.split('/').pop()}.map`), 'utf-8')
}
Each time the project is built, if sourcemap is enabled, each JS file will have a corresponding map file.
bundle.js
bundle.js.map
At this point, the JS file is placed on the static server for user access, while the map file is stored on the server for error message restoration. The source-map library can restore error messages from minified code to their original state. For example, if the minified code error location is line 1, column 47, the restored location might be line 4, column 10. Besides location information, we can also get the original source code.

The image above shows an example of code error restoration. Since this part doesn't belong to the SDK's scope, I created another repository to handle this. Feel free to check it out if you're interested.
Vue Errors
Using window.onerror cannot capture Vue errors - we need to use Vue's provided API for monitoring.
Vue.config.errorHandler = (err, vm, info) => {
    // Print error information to console
    console.error(err)

    lazyReportCache({
        info,
        error: err.stack,
        subType: 'vue',
        type: 'error',
        startTime: performance.now(),
        pageURL: getPageURL(),
    })
}
Behavior Data Collection
PV and UV
PV (Page View) is the number of page views, while UV (Unique Visitor) is the number of unique users visiting. PV counts each page visit, while UV only counts once per user per day.
For frontend, we just need to report PV each time a page is entered. UV statistics are handled on the server side, mainly analyzing reported data to calculate UV.
export default function pv() {
    lazyReportCache({
        type: 'behavior',
        subType: 'pv',
        startTime: performance.now(),
        pageURL: getPageURL(),
        referrer: document.referrer,
        uuid: getUUID(),
    })
}
Page Stay Duration
Record an initial time when users enter the page, then subtract the initial time from the current time when users leave the page to get the stay duration. This calculation logic can be placed in the beforeunload event.
export default function pageAccessDuration() {
    onBeforeunload(() => {
        report({
            type: 'behavior',
            subType: 'page-access-duration',
            startTime: performance.now(),
            pageURL: getPageURL(),
            uuid: getUUID(),
        }, true)
    })
}
Page Access Depth
Recording page access depth is very useful. For example, for different activity pages a and b, if page a has an average access depth of 50% and page b has 80%, it indicates that page b is more popular with users. Based on this, we can make targeted improvements to page a.
Additionally, we can use access depth and stay duration to identify e-commerce order fraud. For example, if someone enters the page and immediately scrolls to the bottom, then waits a while before purchasing, while another person slowly scrolls down the page before purchasing. Even though they have the same stay duration, the first person is more likely to be committing fraud.
The page access depth calculation process is slightly more complex:
- When users enter the page, record the current time, scrollTop value, viewport height, and total page height.
- When users scroll the page, the
scrollevent triggers. In the callback function, use the data from point 1 to calculate page access depth and stay duration. - When users stop scrolling at a certain point to continue viewing the page, record the current time, scrollTop value, viewport height, and total page height.
- Repeat point 2...
Here's the specific code:
let timer
let startTime = 0
let hasReport = false
let pageHeight = 0
let scrollTop = 0
let viewportHeight = 0

export default function pageAccessHeight() {
    window.addEventListener('scroll', onScroll)

    onBeforeunload(() => {
        const now = performance.now()
        report({
            startTime: now,
            duration: now - startTime,
            type: 'behavior',
            subType: 'page-access-height',
            pageURL: getPageURL(),
            value: toPercent((scrollTop + viewportHeight) / pageHeight),
            uuid: getUUID(),
        }, true)
    })

    // Initialize and record current access height and time after page loads
    executeAfterLoad(() => {
        startTime = performance.now()
        pageHeight = document.documentElement.scrollHeight || document.body.scrollHeight
        scrollTop = document.documentElement.scrollTop || document.body.scrollTop
        viewportHeight = window.innerHeight
    })
}

function onScroll() {
    clearTimeout(timer)
    const now = performance.now()

    if (!hasReport) {
        hasReport = true
        lazyReportCache({
            startTime: now,
            duration: now - startTime,
            type: 'behavior',
            subType: 'page-access-height',
            pageURL: getPageURL(),
            value: toPercent((scrollTop + viewportHeight) / pageHeight),
            uuid: getUUID(),
        })
    }

    timer = setTimeout(() => {
        hasReport = false
        startTime = now
        pageHeight = document.documentElement.scrollHeight || document.body.scrollHeight
        scrollTop = document.documentElement.scrollTop || document.body.scrollTop
        viewportHeight = window.innerHeight
    }, 500)
}

function toPercent(val) {
    if (val >= 1) return '100%'
    return (val * 100).toFixed(2) + '%'
}
User Clicks
Using addEventListener() to monitor mousedown and touchstart events, we can collect information about each click area's size, click coordinates' specific position in the page, clicked element's content, and other information.
export default function onClick() {
    ['mousedown', 'touchstart'].forEach(eventType => {
        let timer
        window.addEventListener(eventType, event => {
            clearTimeout(timer)
            timer = setTimeout(() => {
                const target = event.target
                const { top, left } = target.getBoundingClientRect()

                lazyReportCache({
                    top,
                    left,
                    eventType,
                    pageHeight: document.documentElement.scrollHeight || document.body.scrollHeight,
                    scrollTop: document.documentElement.scrollTop || document.body.scrollTop,
                    type: 'behavior',
                    subType: 'click',
                    target: target.tagName,
                    paths: event.path?.map(item => item.tagName).filter(Boolean),
                    startTime: event.timeStamp,
                    pageURL: getPageURL(),
                    outerHTML: target.outerHTML,
                    innerHTML: target.innerHTML,
                    width: target.offsetWidth,
                    height: target.offsetHeight,
                    viewport: {
                        width: window.innerWidth,
                        height: window.innerHeight,
                    },
                    uuid: getUUID(),
                })
            }, 500)
        })
    })
}
Page Navigation
Using addEventListener() to monitor popstate and hashchange page navigation events. Note that calling history.pushState() or history.replaceState() won't trigger the popstate event. The event only triggers when users perform browser actions, such as clicking the browser's back button (or calling history.back() or history.forward() methods in JavaScript code). The same applies to hashchange.
export default function pageChange() {
    let from = ''
    window.addEventListener('popstate', () => {
        const to = getPageURL()

        lazyReportCache({
            from,
            to,
            type: 'behavior',
            subType: 'popstate',
            startTime: performance.now(),
            uuid: getUUID(),
        })

        from = to
    }, true)

    let oldURL = ''
    window.addEventListener('hashchange', event => {
        const newURL = event.newURL

        lazyReportCache({
            from: oldURL,
            to: newURL,
            type: 'behavior',
            subType: 'hashchange',
            startTime: performance.now(),
            uuid: getUUID(),
        })

        oldURL = newURL
    }, true)
}
Vue Router Changes
Vue can use the router.beforeEach hook to monitor route changes.
export default function onVueRouter(router) {
    router.beforeEach((to, from, next) => {
        // Don't count first page load
        if (!from.name) {
            return next()
        }

        const data = {
            params: to.params,
            query: to.query,
        }

        lazyReportCache({
            data,
            name: to.name || to.path,
            type: 'behavior',
            subType: ['vue-router-change', 'pv'],
            startTime: performance.now(),
            from: from.fullPath,
            to: to.fullPath,
            uuid: getUUID(),
        })

        next()
    })
}
Data Reporting
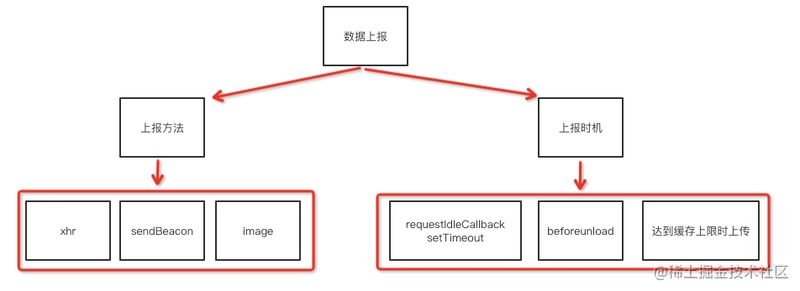
Reporting Methods
Data can be reported using the following methods:
- sendBeacon
- XMLHttpRequest
- image
My simple SDK uses a combination of the first and second methods for reporting. Using sendBeacon for reporting has very obvious advantages.
Using the
sendBeacon()method will send data to the server asynchronously when the user agent has an opportunity, without delaying page unload or affecting the performance of the next navigation. This solves all the problems with submitting analytics data: data is reliable, transmission is asynchronous, and it won't affect the loading of the next page.
For browsers that don't support sendBeacon, we can use XMLHttpRequest for reporting. An HTTP request consists of sending and receiving two steps. Actually, for reporting, we just need to ensure the data can be sent - we don't need to receive the response. For this reason, I did an experiment where I sent 30kb of data (generally reported data rarely exceeds this size) using XMLHttpRequest in beforeunload, tested with different browsers, and all were able to send successfully. Of course, this also depends on hardware performance and network conditions.
Reporting Timing
There are three reporting timings:
- Use
requestIdleCallback/setTimeoutfor delayed reporting - Report in the beforeunload callback function
- Cache reported data and report when reaching a certain amount
It's recommended to combine all three methods:
- First cache the reported data, and when reaching a certain amount, use
requestIdleCallback/setTimeoutfor delayed reporting - Report all unreported data when leaving the page
Summary
Since theoretical knowledge alone can be difficult to understand, I've created a simple monitoring SDK that implements the technical concepts discussed in this article. You can use it to create simple demos and gain a better understanding. Reading this article while experimenting with the SDK will provide the best learning experience.
References
Performance Monitoring
- Performance API
- PerformanceResourceTiming
- Using_the_Resource_Timing_API
- PerformanceTiming
- Metrics
- evolving-cls
- custom-metrics
- web-vitals
- PerformanceObserver
- Element_timing_API
- PerformanceEventTiming
- Timing-Allow-Origin
- bfcache
- MutationObserver
- XMLHttpRequest
- How to Monitor Page Stuttering
- sendBeacon