


![Nomad Goods Launches 15% Sitewide Sale for 48 Hours Only [Deal]](https://www.iclarified.com/images/news/96899/96899/96899-640.jpg)


![Apple Watch Series 10 Prototype with Mystery Sensor Surfaces [Images]](https://www.iclarified.com/images/news/96892/96892/96892-640.jpg)


![[The AI Show Episode 142]: ChatGPT’s New Image Generator, Studio Ghibli Craze and Backlash, Gemini 2.5, OpenAI Academy, 4o Updates, Vibe Marketing & xAI Acquires X](https://www.marketingaiinstitute.com/hubfs/ep%20142%20cover.png)


![Is this a suitable approach to architect a flutter app? [closed]](https://i.sstatic.net/4hMHGb1L.png)


![From broke musician to working dev. How college drop-out Ryan Furrer taught himself to code [Podcast #166]](https://cdn.hashnode.com/res/hashnode/image/upload/v1743189826063/2080cde4-6fc0-46fb-b98d-b3d59841e8c4.png?#)


.png?width=1920&height=1920&fit=bounds&quality=80&format=jpg&auto=webp#)


_kYeMsh2.png?width=1920&height=1920&fit=bounds&quality=80&format=jpg&auto=webp#)


Process Monitoring: Keeping Systems in Check
Process monitoring is the practice of continuously observing and analyzing system processes to maintain optimal performance, detect issues early, and ensure system stability. It involves tracking resource utilization, execution states, and dependencies of running processes. By leveraging process monitoring, system administrators and developers can proactively address bottlenecks, prevent failures, and optimize system resources. Modern monitoring tools provide insights into CPU usage, memory consumption, input/output operations, and thread activity. These tools often feature real-time dashboards, alerting mechanisms, and historical logging to facilitate efficient troubleshooting and capacity planning. Essential Process Monitoring Tools Several utilities help in tracking process activity in Linux-based systems. Below are some widely used tools and their applications. 1. htop - Interactive Process Viewer htop is an advanced interactive tool for monitoring system processes in real time. Unlike top, it offers a color-coded interface, supports scrolling, and allows users to manage processes directly within the interface. Install htop: sudo apt install htop # Debian/Ubuntu sudo yum install htop # CentOS/RHEL Run htop: htop Key Features: Displays CPU, memory, and swap usage in a graphical format. Allows killing or renicing processes directly. Supports process filtering and sorting by different metrics. Check btop 2. pidstat - Resource Usage per Process pidstat provides a breakdown of CPU, memory, I/O, and thread activity for each process, making it useful for diagnosing performance issues. Install pidstat: sudo apt install sysstat # Debian/Ubuntu Track CPU usage by process: pidstat -u 1 Monitor disk I/O per process: pidstat -d 1 Key Features: Reports CPU, memory, and I/O usage per process. Helps in identifying processes causing high resource consumption. Supports exporting data for historical analysis. 3. strace - System Call Tracer strace is invaluable for debugging and understanding how a process interacts with the system kernel. Trace system calls of a running process: strace -p Run a command with strace: strace ls Key Features: Tracks system calls and signals used by a process. Helps diagnose slow performance or permission-related issues. Useful for debugging unknown binary applications. 4. lsof - List Open Files Since Unix-like systems treat everything as a file, lsof helps track which files (including network sockets) are accessed by processes. List all open files: lsof Show files opened by a specific process: lsof -p List processes using a specific port: lsof -i :80 Key Features: Identifies files in use by processes. Helps troubleshoot file access issues and network connections. Assists in identifying processes locking a file or port. 5. ps - Snapshot of Running Processes ps provides a static view of currently running processes, useful for scripting and one-time analysis. List all running processes: ps aux Filter by user: ps -u Display process tree: ps -ef --forest Key Features: Provides detailed information about running processes. Useful for historical analysis and debugging. Supports custom formatting and filtering. Automating Process Monitoring For continuous monitoring, tools like Prometheus, Grafana, and Nagios are commonly used. They collect system metrics, visualize data, and trigger alerts based on predefined thresholds. Conclusion Process monitoring is essential for ensuring the reliability, performance, and security of IT systems. Whether using command-line utilities like htop, lsof, and pidstat or adopting advanced tools like Prometheus and Grafana, monitoring enables early detection of issues and helps optimize resource allocation. Integrating automated alerts and historical logging further enhances system observability, making troubleshooting and maintenance more efficient. I’ve been working on a super-convenient tool called LiveAPI. LiveAPI helps you get all your backend APIs documented in a few minutes With LiveAPI, you can quickly generate interactive API documentation that allows users to execute APIs directly from the browser. If you’re tired of manually creating docs for your APIs, this tool might just make your life easier.
Process monitoring is the practice of continuously observing and analyzing system processes to maintain optimal performance, detect issues early, and ensure system stability.
It involves tracking resource utilization, execution states, and dependencies of running processes.
By leveraging process monitoring, system administrators and developers can proactively address bottlenecks, prevent failures, and optimize system resources.
Modern monitoring tools provide insights into CPU usage, memory consumption, input/output operations, and thread activity.
These tools often feature real-time dashboards, alerting mechanisms, and historical logging to facilitate efficient troubleshooting and capacity planning.
Essential Process Monitoring Tools
Several utilities help in tracking process activity in Linux-based systems.
Below are some widely used tools and their applications.
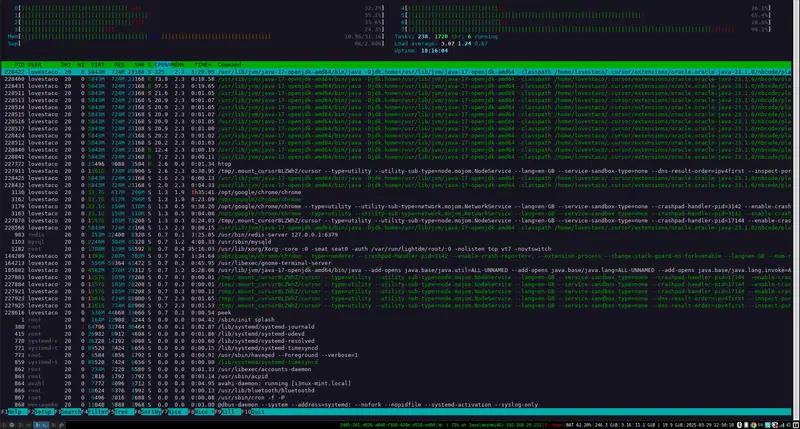
1. htop - Interactive Process Viewer
htop is an advanced interactive tool for monitoring system processes in real time. Unlike top, it offers a color-coded interface, supports scrolling, and allows users to manage processes directly within the interface.
Install htop:
sudo apt install htop  # Debian/Ubuntu
sudo yum install htop  # CentOS/RHEL
Run htop:
htop
Key Features:
- Displays CPU, memory, and swap usage in a graphical format.
- Allows killing or renicing processes directly.
- Supports process filtering and sorting by different metrics.
Check btop
2. pidstat - Resource Usage per Process
pidstat provides a breakdown of CPU, memory, I/O, and thread activity for each process, making it useful for diagnosing performance issues.
Install pidstat:
sudo apt install sysstat # Debian/Ubuntu
Track CPU usage by process:
pidstat -u 1
Monitor disk I/O per process:
pidstat -d 1
Key Features:
- Reports CPU, memory, and I/O usage per process.
- Helps in identifying processes causing high resource consumption.
- Supports exporting data for historical analysis.

3. strace - System Call Tracer
strace is invaluable for debugging and understanding how a process interacts with the system kernel.
Trace system calls of a running process:
strace -p
Run a command with strace:
strace ls
Key Features:
- Tracks system calls and signals used by a process.
- Helps diagnose slow performance or permission-related issues.
- Useful for debugging unknown binary applications.
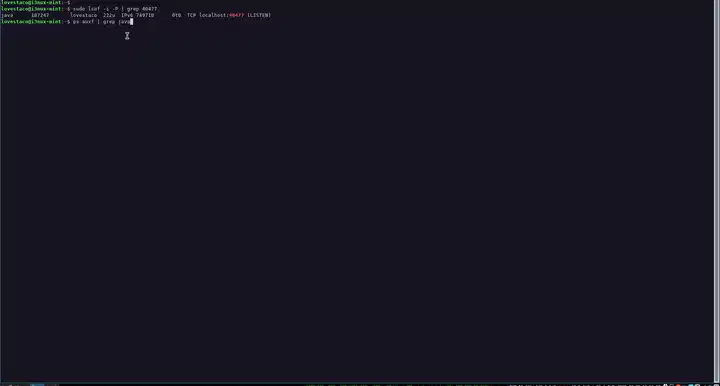
4. lsof - List Open Files
Since Unix-like systems treat everything as a file, lsof helps track which files (including network sockets) are accessed by processes.
List all open files:
lsof
Show files opened by a specific process:
lsof -p
List processes using a specific port:
lsof -i :80
Key Features:
- Identifies files in use by processes.
- Helps troubleshoot file access issues and network connections.
- Assists in identifying processes locking a file or port.
5. ps - Snapshot of Running Processes
ps provides a static view of currently running processes, useful for scripting and one-time analysis.
List all running processes:
ps aux
Filter by user:
ps -u
Display process tree:
ps -ef --forest
Key Features:
- Provides detailed information about running processes.
- Useful for historical analysis and debugging.
- Supports custom formatting and filtering.
Automating Process Monitoring
For continuous monitoring, tools like Prometheus, Grafana, and Nagios are commonly used.
They collect system metrics, visualize data, and trigger alerts based on predefined thresholds.
Conclusion
Process monitoring is essential for ensuring the reliability, performance, and security of IT systems.
Whether using command-line utilities like htop, lsof, and pidstat or adopting advanced tools like Prometheus and Grafana, monitoring enables early detection of issues and helps optimize resource allocation.
Integrating automated alerts and historical logging further enhances system observability, making troubleshooting and maintenance more efficient.
I’ve been working on a super-convenient tool called LiveAPI.
LiveAPI helps you get all your backend APIs documented in a few minutes
With LiveAPI, you can quickly generate interactive API documentation that allows users to execute APIs directly from the browser.

If you’re tired of manually creating docs for your APIs, this tool might just make your life easier.